- Pullbacks of 5% or more in the S&P 500 are relatively common, having occurred on average three times per year since 1930.
- Despite a recent market correction, the S&P 500 is still up 10% year-to-date, and the Nasdaq 100 is up 8.5% year-to-date.
- The S&P 500 faces technical resistance at the 100-day moving average (between 5330 and 5267), with further resistance expected at 5391 and 5500.
- The Nasdaq 100 has support around 17800 (the 200-day moving average) and faces resistance at 18416 and 18800 (the 100-day moving average).
Most Read: Oil Prices Near Recent Lows: Demand Concerns Keep Bulls at Bay
Wall Street’s primary indexes have found some stability following a blockbuster start to the week. As the US session commenced, all major S&P sectors were trading higher, buoyed by improved market sentiment and a dovish stance from Japanese policymakers.
The market volatility experienced since late last week was partly triggered by the Bank of Japan’s surprise rate hike, prompting many institutions to unwind carry trades and cover positions. Additionally, fears of a global recession exacerbated the situation.
In early trading today, Amazon (AMZN.O) led the gains, rising about 2.6%. Focus has shifted back to earnings, with Airbnb struggling, down 12.7%. The company forecasted third-quarter revenue below estimates and warned of shorter booking windows and challenges ahead in H2 2024.
It’s essential to maintain perspective. Despite the recent correction, the S&P 500 is still up 10% year-to-date, and the Nasdaq 100 is up 8.5% year-to-date.
Despite this week’s market panic, pullbacks of 5% or more in the S&P 500 are relatively common. Since 1930, the S&P 500 has experienced an average of three 5% pullbacks per year.
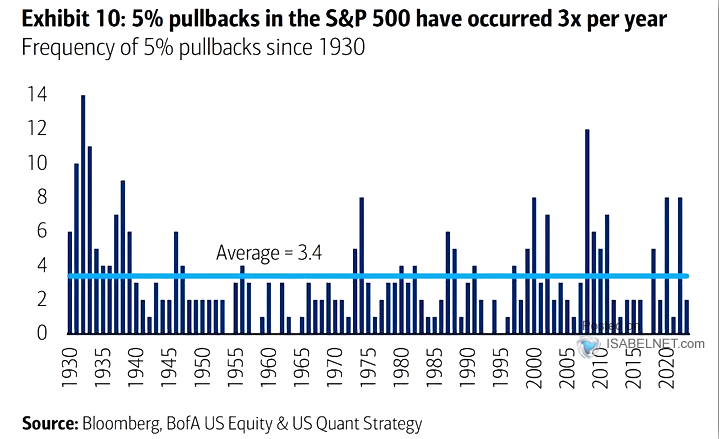
Source: Bloomberg, BofA Research, Isabelnet
Another chart I found interesting which relates to the S&P 500 shows a median peak-to-trough decline of around 10% since 1985. Comparing this to the recent 8% decline in the S&P 500, it offers some food for thought. Market participants often swing from one extreme to another, making these charts valuable for providing insight and perspective on recent market movements.
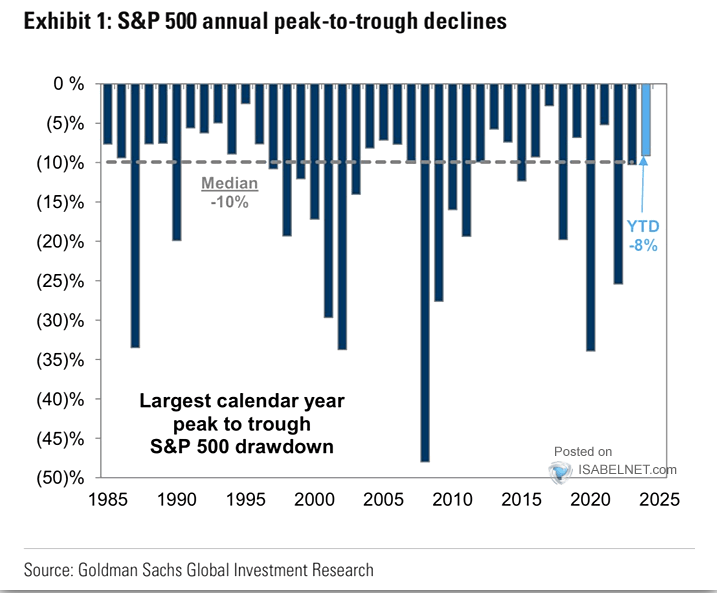
Source: Goldman Sachs Global Investment
Technical Analysis S&P 500
From a technical standpoint, the S&P 500 has gained some traction today following a period of consolidation on Tuesday. However, numerous technical hurdles remain for the bulls if the rally is to continue.
Today’s rally encountered resistance at the 100-day moving average, situated in a confluence zone between 5330 and 5267. This area presents several challenges, with further resistance expected at 5391 before the psychological level of 5500 becomes a focal point.
S&P 500 Daily Chart, August 7, 2024
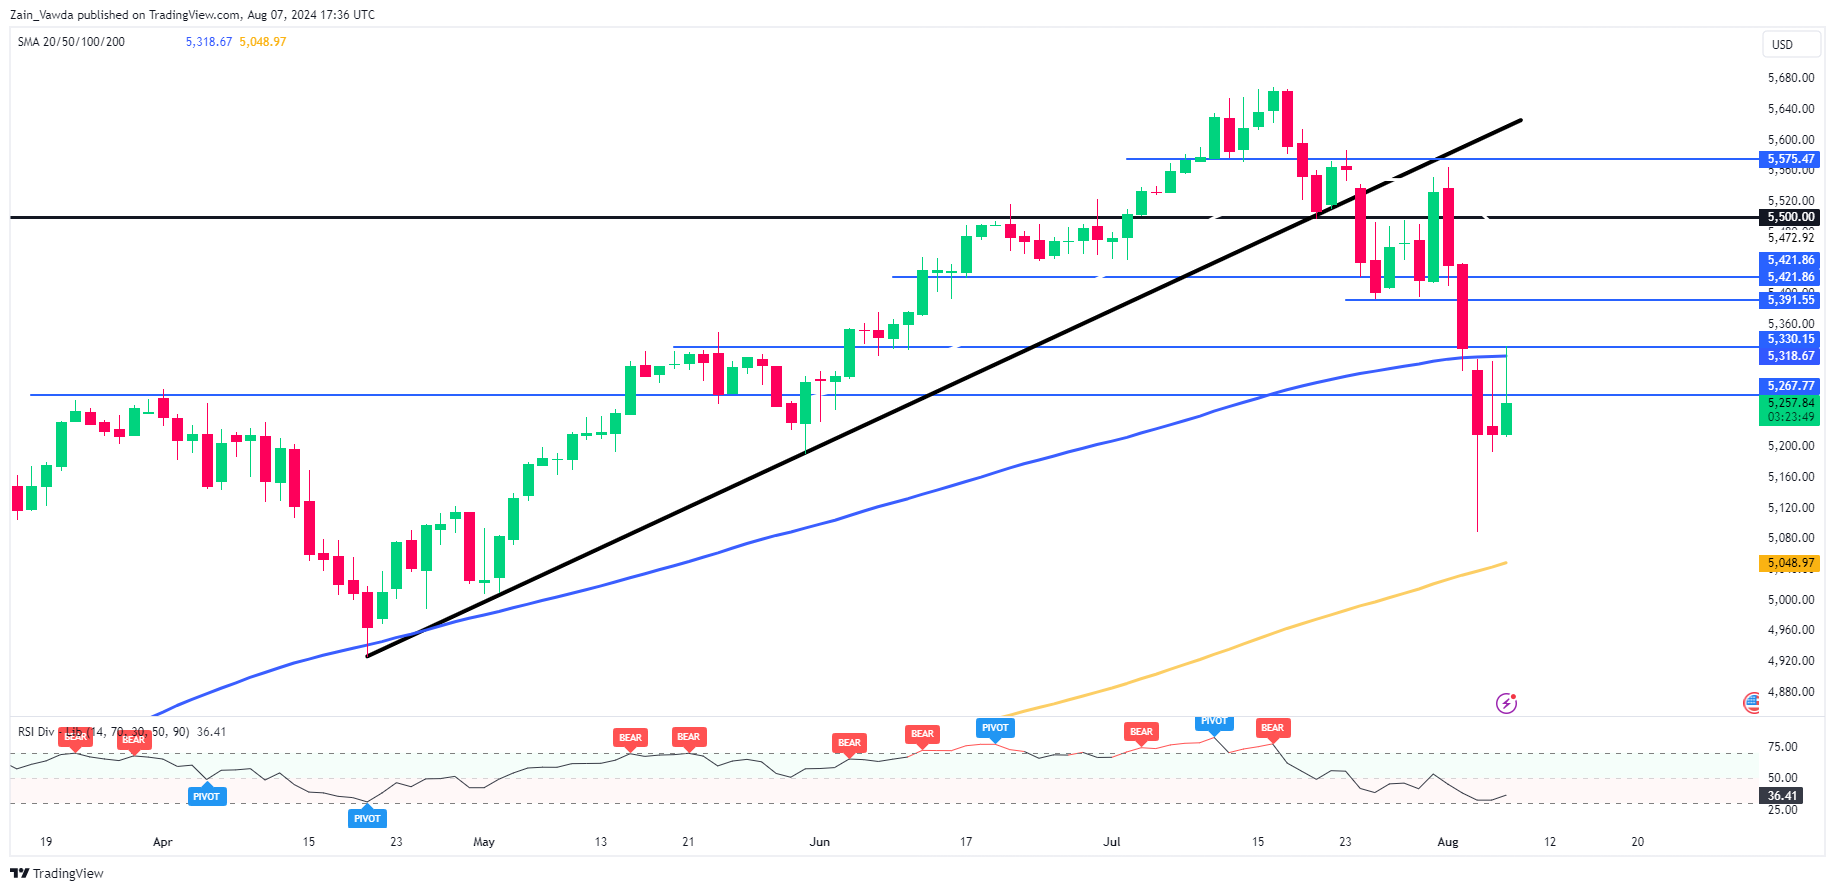
Source: TradingView (click to enlarge)
Support
- 5193
- 5092
- 5048 (200-day MA)
Resistance
- 5330
- 5391
- 5421
- 5500
Nasdaq 100
The Nasdaq 100 chart closely mirrors the S&P 500, featuring a strong support base around the 17800 handle where the 200-day moving average is located.
Earlier this week, the 17300 support area was tested on Monday, but buyers intervened, pushing the price back above the 200-day moving average.
On the upside, immediate resistance was encountered today at 18416. Further resistance lies at the 100-day moving average at 18800, before the descending trendline comes into focus.
Nasdaq 100 Daily Chart, August 7, 2024
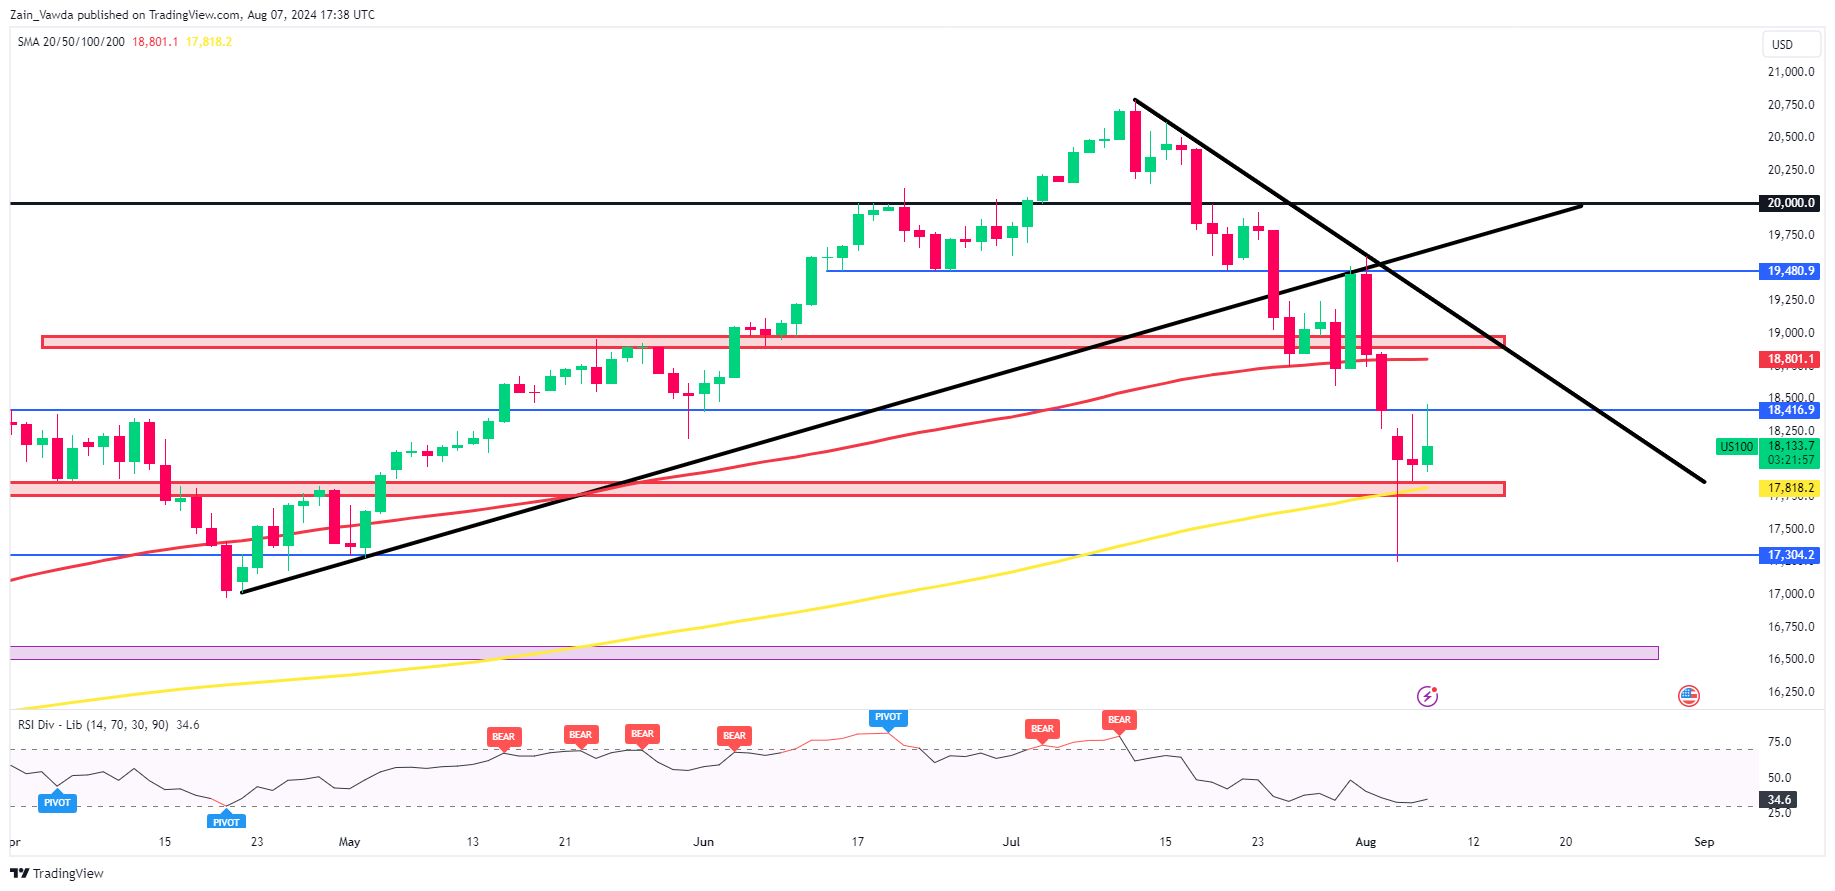
Source: TradingView (click to enlarge)
Support
- 17300
- 17000
- 16600
Resistance
- 18416
- 18800
- 19000
Follow Zain on Twitter/X for Additional Market News and Insights @zvawda
Content is for general information purposes only. It is not investment advice or a solution to buy or sell securities. Opinions are the authors; not necessarily that of OANDA Business Information & Services, Inc. or any of its affiliates, subsidiaries, officers or directors. If you would like to reproduce or redistribute any of the content found on MarketPulse, an award winning forex, commodities and global indices analysis and news site service produced by OANDA Business Information & Services, Inc., please access the RSS feed or contact us at info@marketpulse.com. Visit https://www.marketpulse.com/ to find out more about the beat of the global markets. © 2023 OANDA Business Information & Services Inc.

Zain Vawda
He has spent the last 3 years in an analyst role honing his skills across various financial domains, including technical analysis, economic data interpretation, price action strategies, and analyzing the geopolitical impacts on global markets. Currently, Zain is advancing in obtaining his Capital Markets & Security Analyst (CMSA) designation through the Corporate Finance Institute (CFI), where he has completed modules in fixed income fundamentals, portfolio management fundamentals, equity market fundamentals, introduction to capital markets, and derivative fundamentals.
He is also a regular guest on radio and television programs in South Africa, providing insight into global markets and the economy. Additionally, he has contributed to the development of a financial markets course approved by BankSeta (Banking Sector Education and Training Authority) at NQF level 6 in South Africa.