- US stocks have seen two years of strong growth, driven by tech and AI stocks, and are expected to continue performing well in 2025.
- Concerns remain about high valuations and the dominance of the “Magnificent Seven” tech stocks.
- Tesla deliveries fell in the fourth quarter of 2024 due to increased competition and reduced subsidies.
- January historically sees strong performance in US stocks, and technical analysis suggests the S&P 500 may be poised for a recovery.
Most Read: Brent Crude – Oil Eyes Break of Key Confluence Level on Chinese Optimism
US stocks have just enjoyed their second blockbuster year which has propelled Wall Street Indexes to fresh ATHs. Markets are now eyeing a hat-trick of impressive years as President Elect Donald Trump gets ready to return to the White House.
A combination of a solid economy supporting corporate profits, moderating interest rates and pro growth policies are seen by many as the reason 2025 could be another positive year for US equities. The S&P 500 has just recorded its second year of 20% + growth, which also means it has recorded the biggest two-year percentage jump since 1998 per Reuters.
Concern Around ‘Magnificent 7’ dominance
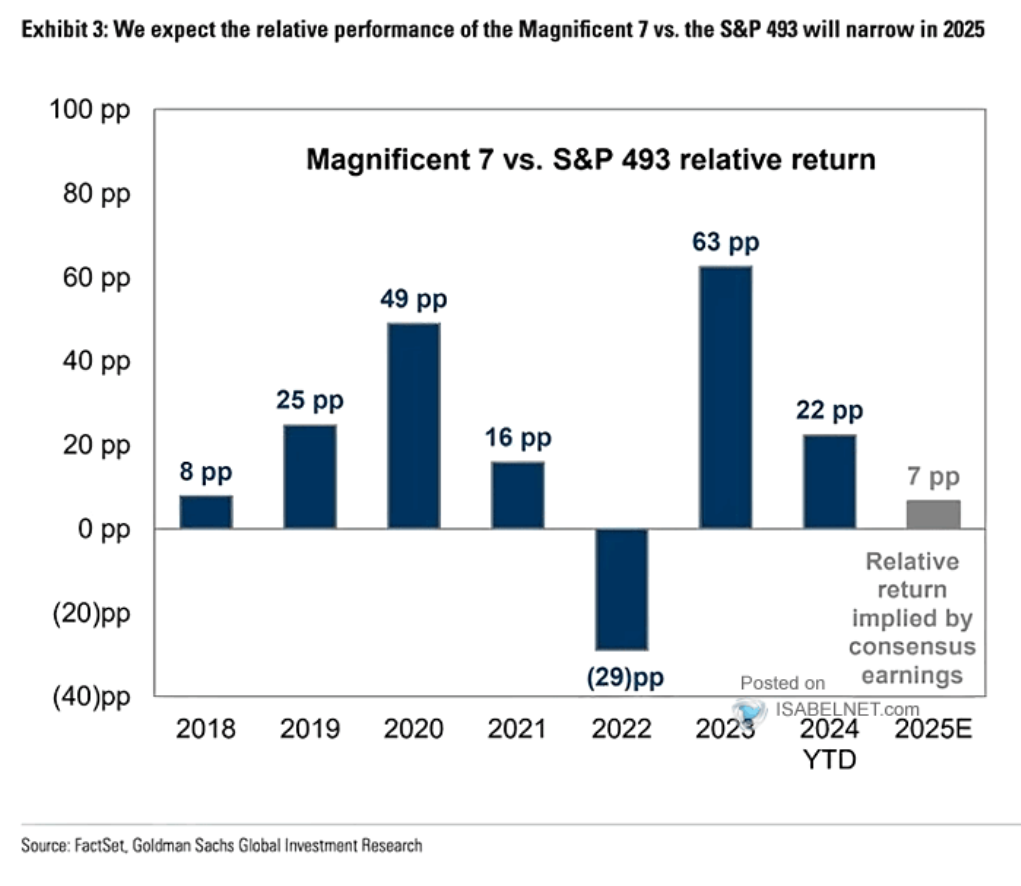
The past two years have also brought up many questions by market participants. The reason being that the rally has been fueled by tech and AI stocks while the magnificent 7 now accounts for about 35% +- of the S&P 500. This has raised concerns with many comparing the rise of AI stocks to that of the dotcom bubble.
While the Magnificent Seven are expected to continue performing well, their relative outperformance compared to the S&P 493 is projected to be only 7% in 2025, indicating a potential shift in market leadership. This is according to data from Goldman Sachs Global Investment Research.
Source: Goldman Sachs Global Investment Research, Isabelnet (click to enlarge)
Market participants seem less concerned with the high valuation environment as the S&P 500 leaves 2024 trading at 24.82 times expected earnings over the next 12 months. According to LSEG, that is well above its long-term average of 15.8, and not far from the 22.6 level it reached earlier this month, its highest since early 2021.
The downside of high valuation historically shows that stocks are more volatile when market expectations are not met with wild swings often occurring. Will 2025 deliver more of the same?
Tesla Deliveries Fall – Competition Heats Up
Elon Musk has been in the news for his rising political and socio-economic commentary of late. However, the year could not get off to a worse start for the world’s richest man as Tesla announced its first drop in yearly deliveries on Thursday, as it delivered fewer electric vehicles than expected in the fourth quarter, and incentives didn’t increase demand for its older models.
Tesla is facing challenges due to reduced subsidies in Europe, a U.S. trend towards cheaper hybrid cars, and stronger competition from China’s BYD.
Tesla was down as much as 3.5% before the opening bell and remains down around 3.8% at the time of writing. Despite this the Nasdaq 100 remains on the front foot following the opening bell, the index was up just over 1%.
Looking Ahead
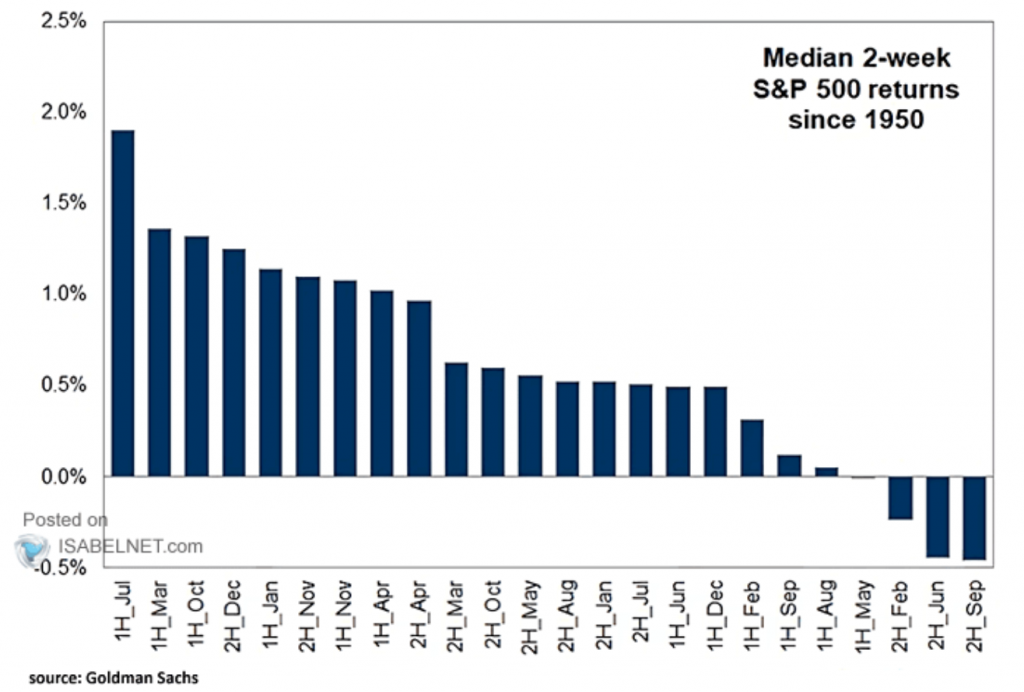
Looking back at historical performance during the month of January and we see an interesting picture. Based on available data, January usually sees increased investor activity in equity markets, resulting in strong inflows, as the start of a new year often inspires renewed investment strategies and goals.
Another intriguing data point from January shows that US stocks have a tendency to perform strongly during the first half of January, due to factors such as increased investment activity, and positive investor sentiment following the New Year.
Source: Isabelnet, Goldman Sachs (click to enlarge)
Taking the above into account and with the lackluster ‘Santa Rally’ are US stocks on course for a rise ahead of Donald Trump’s inauguration on January 21?
Technical Analysis
S&P 500
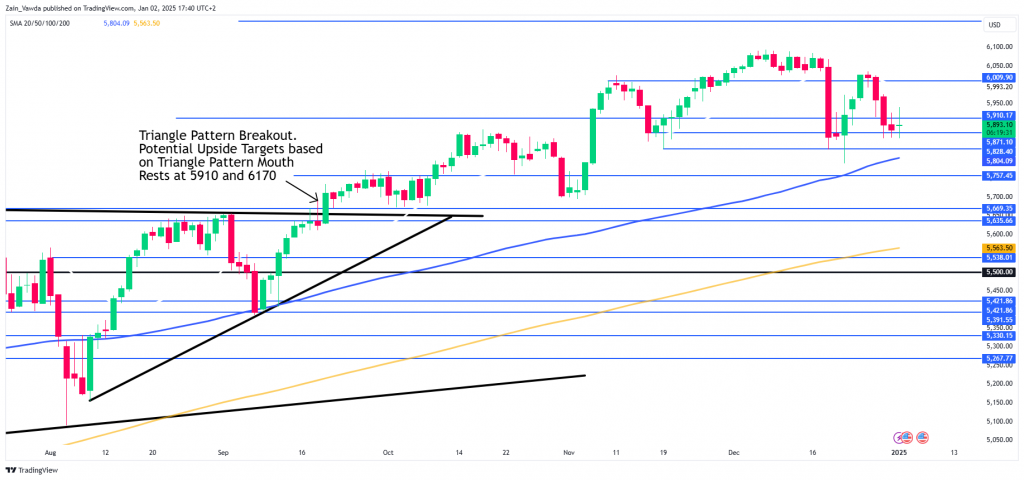
From a technical standpoint, the S&P 500 on a daily timeframe remains bearish following a series of lower highs and lower lows.
However, market participants have failed to print a significant lower low over the last 3 trading days which is a sign that bullish pressure may be building. A bullish daily candle close or a a doji daily candle close could set the index up for a recovery.
Looking at the daily chart above and a daily candle close above the recent swing high at 6026 is needed for a structure change which may embolden bulls even more. This could lead to a push toward fresh all time highs.
The 100-day MA is resting at the 5804 handle and a test of this cannot be ruled out before a rally to the upside. Support below the 100-day MA may be found at 5757, 5700 and 5669 respectively.
S&P 500 Daily Chart, January 2, 2025
Source: TradingView (click to enlarge)
Support
- 5804
- 5757
- 5700
Resistance
- 5910
- 5950
- 6000
Follow Zain on Twitter/X for Additional Market News and Insights @zvawda
Content is for general information purposes only. It is not investment advice or a solution to buy or sell securities. Opinions are the authors; not necessarily that of OANDA Business Information & Services, Inc. or any of its affiliates, subsidiaries, officers or directors. If you would like to reproduce or redistribute any of the content found on MarketPulse, an award winning forex, commodities and global indices analysis and news site service produced by OANDA Business Information & Services, Inc., please access the RSS feed or contact us at info@marketpulse.com. Visit https://www.marketpulse.com/ to find out more about the beat of the global markets. © 2023 OANDA Business Information & Services Inc.


