- Over the past two weeks, US investors have shed nearly $30 billion dollars of US equity funds (net selling) according to data from LSEG.
- A bullish week for the S&P 500 but the Nasdaq 100 looks less convincing.
- A pullback in Nvidia stock and the psychological 20000 barrier have halted the Nasdaq’s impressive early week rally.
- Technicals are delicately poised as we await the final GDP and PCE (the Fed’s preferred inflation gauge) data next week.
Fundamental Overview
A big week for US indices as both the S&P and Nasdaq 100 crossed key psychological levels in 5500 and 20000 respectively. The relatively brief time each index managed to sustain above these levels highlights the fact that acceptance above such barriers take time, The selloff came in part thanks to a drop off in Nvidia with the chip maker continuing its slide, posting losses of 1.4% in pre-market trade on Friday. The ongoing debate around Nvidia and whether or not the current valuations around the chip maker continues to rumble on.
Mixed data from the US continued in the early part of the week as a string of weak economic data and commentary from Federal Reserve policymakers that rates could remain higher for longer sent conflicting messages. Inflationary concerns remain in play despite producer price inflation numbers showing positive signs. Rising geopolitical tensions are seen as the major bump in the road which could prove detrimental to the fight against inflation.
Friday saw a further slide for US equities which was a slight surprise given the PMI data for manufacturing and services beat estimates. This disconnect between data and US stocks has been a growing trend for quite some time now and seems set to continue.
There are signs however that point to the possibility of a deeper correction and could be behind the slump in US Indices as the week progressed. US investors shed equity funds for a second successive week in the seven days ending June 19. This means over the past two weeks, US investors have shed nearly $30 billion dollars of US equity funds (net selling) according to data from LSEG. If you break it down by segment, US large cap and multi-cap funds led the outflows with the healthcare and industrial sectors leading the way. Surprisingly and despite valuation concerns the tech sector experienced a second week of inflows, attracting around $554 million (net).
Fund Flows: US Equity Sector Funds Through Jun 19, 2024
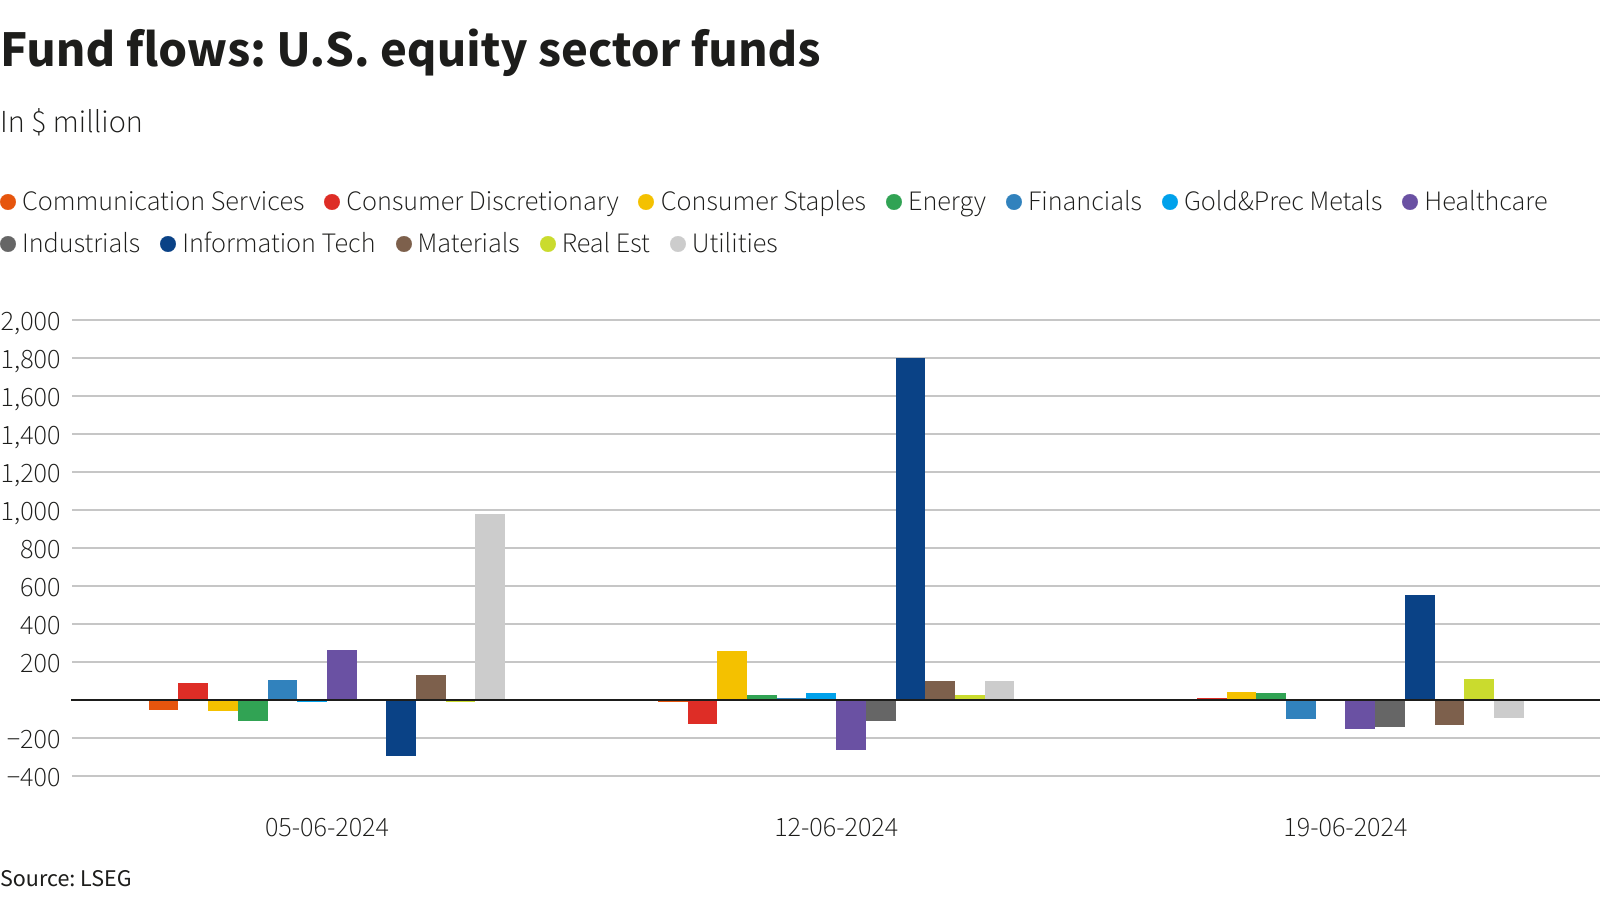
Source: LSEG Eikon (click to enlarge)
On the other end of the spectrum, short interest on SPY and QQQ US ETFS is low, showing little speculation on price declines. Low short interest indicates that relatively few investors are betting against the ETF. This suggests a general lack of pessimism about the future performance of the underlying indices (S&P 500 for SPY and Nasdaq-100 for QQQ). This could mean that the current pullback may be viewed as an opportunity by institutions to get in at better prices and capitalize on another bullish run to the upside. Looking at the two data points discussed above, they provide mixed signals in a similar vein to US economic data. Definitely a lot to consider for market participants moving forward.
S&P 500 – Short Interest on the SPY and QQQ US ETFs
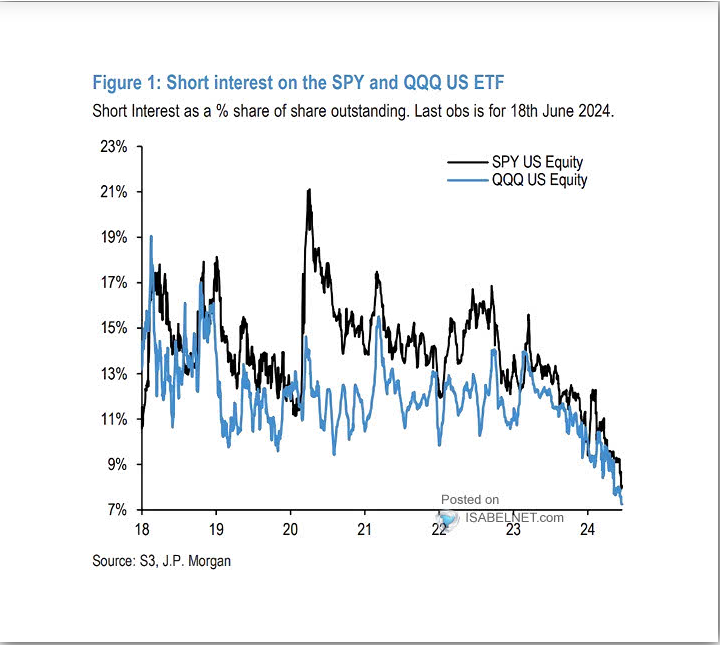
Source: S3, JP Morgan, Isabelnet (click to enlarge)
The Week Ahead: US GDP AND PCE Data
Looking ahead to next week, market participants will monitor the Fed’s preferred inflation gauge, the PCE index due for release on Friday June 28, 2024. The data will likely add another layer to what is an already complex equation as the Fed grapples with the home stretch on the inflation front.
Other key events from the US include CB consumer confidence data, Bank stress test results, durable goods orders and more comments from Federal Reserve policymakers. It will be an intriguing week as both the S&P and Nasdaq are hovering around key levels of support.
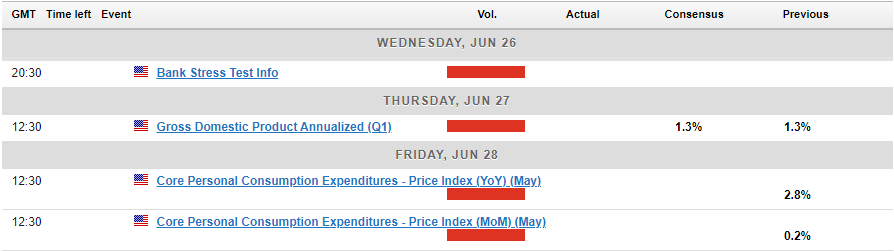
For all market-moving economic releases and events, see the MarketPulse Economic Calendar.
S&P 500 and NASDAQ 100 Technical Outlook
S&P 500
Looking at the S&P from a technical perspective, and the weekly chart did show a rejection of the psychological 5500 mark. Thursdays daily candle closing as an imperfect shooting star but is struggling to achieve follow through on Friday (at the time of writing). The RSI on a daily timeframe is also threatening to cross back below the 70 handle from overbought territory which is usually a sign that momentum may be shifting.
Looking at the H4 chart below and the S&P has been trading in a channel since the end of May. On Friday price threatened to break down below this channel which could open up a deeper selloff toward support at 5420. Any push below that and the 100-day MA comes into focus currently resting at 5374 with the 200 day MA the next area of interest at 5321.
S&P 500 Four-Hour Chart, June 21, 2024
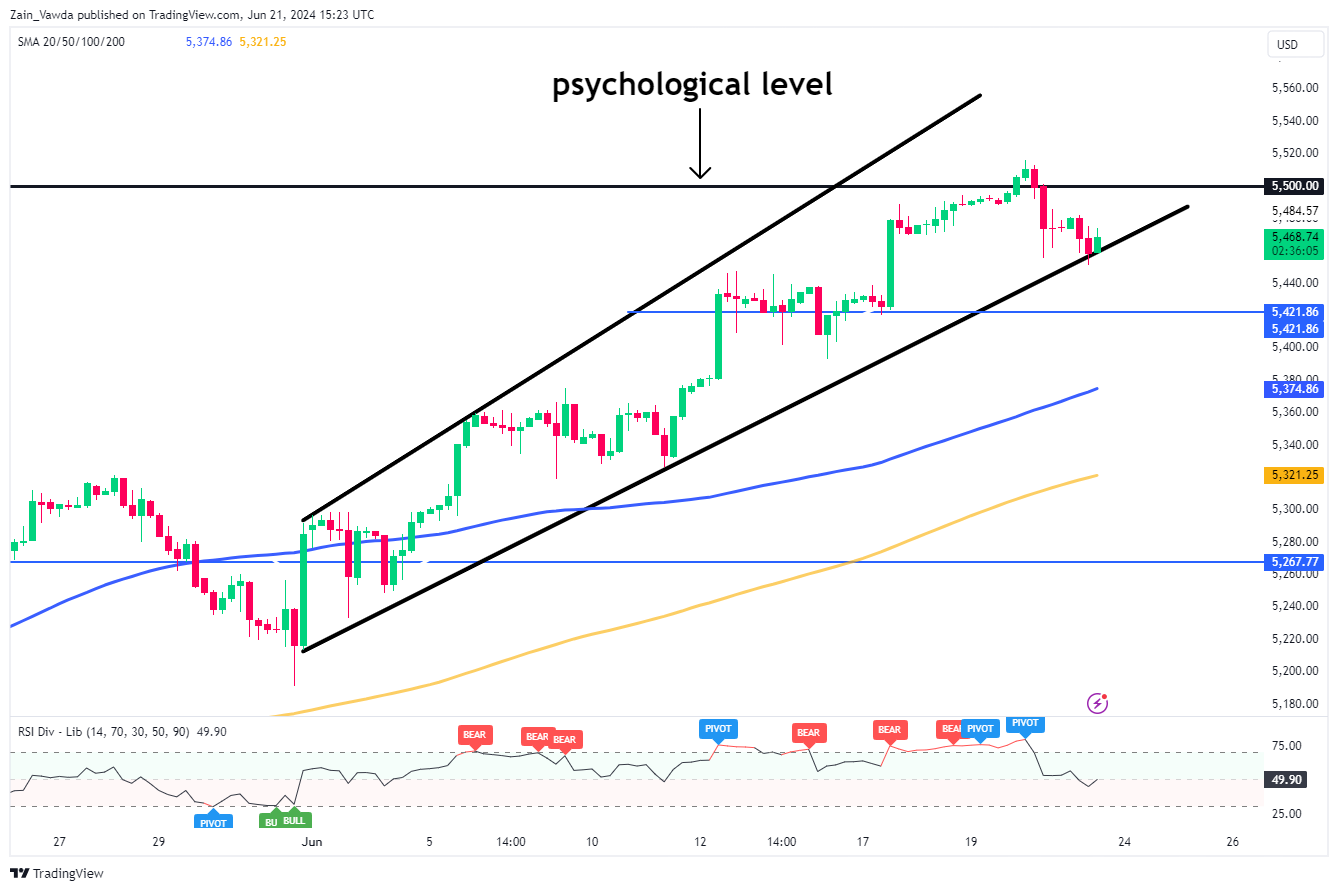
Source: TradingView.com (click to enlarge)
NASDAQ 100
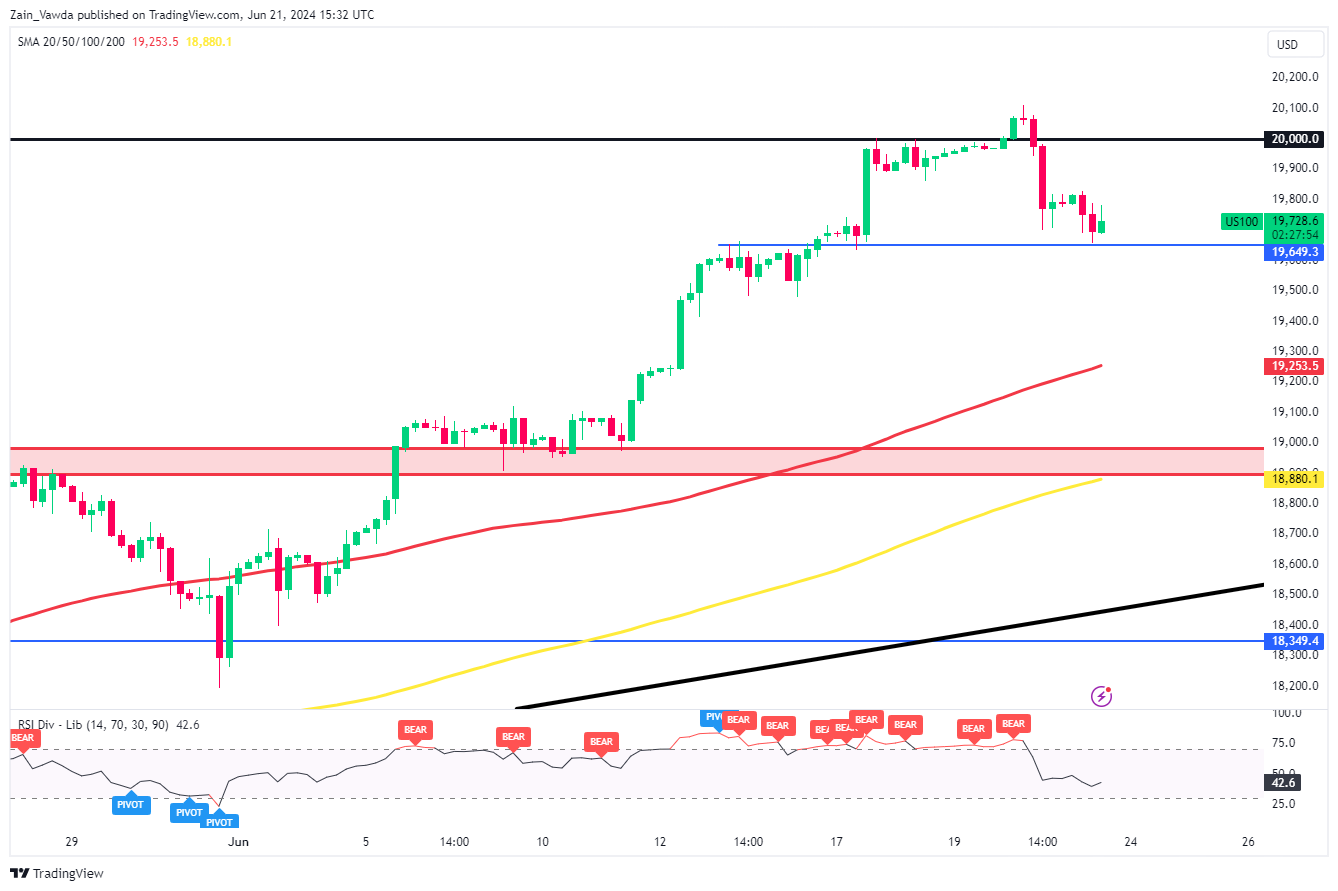
Looking at the Nasdaq 100 weekly chart and the rejection of the 20000 has left the weekly candle battling to close in the green. A bearish close will require the Nasdaq to close below the 19670 mark, and should it happen will no doubt stoke the interest of potential shorts. The daily is almost a mirror image of the S&P chart as a key support level may keep a bearish weekly close at bay.
The H$ chart below shows price testing the support handle around the 19650 mark with a break below opening up a retest of support at 19500. Beyond that we have support provided by the 100-day MA at 19253 and then the psychological 19000 level which coincides with the 200-day MA.
Alternatively a push higher from here needs to navigate the 20000 psychological barrier and post a daily close above. this would be the first sign of acceptance by market participants before resistance at 20500 comes into play.
NASDAQ 100 Four-Hour Chart, June 21, 2024
Source: TradingView.com (click to enlarge)
Content is for general information purposes only. It is not investment advice or a solution to buy or sell securities. Opinions are the authors; not necessarily that of OANDA Business Information & Services, Inc. or any of its affiliates, subsidiaries, officers or directors. If you would like to reproduce or redistribute any of the content found on MarketPulse, an award winning forex, commodities and global indices analysis and news site service produced by OANDA Business Information & Services, Inc., please access the RSS feed or contact us at info@marketpulse.com. Visit https://www.marketpulse.com/ to find out more about the beat of the global markets. © 2023 OANDA Business Information & Services Inc.

Zain Vawda
He has spent the last 3 years in an analyst role honing his skills across various financial domains, including technical analysis, economic data interpretation, price action strategies, and analyzing the geopolitical impacts on global markets. Currently, Zain is advancing in obtaining his Capital Markets & Security Analyst (CMSA) designation through the Corporate Finance Institute (CFI), where he has completed modules in fixed income fundamentals, portfolio management fundamentals, equity market fundamentals, introduction to capital markets, and derivative fundamentals.
He is also a regular guest on radio and television programs in South Africa, providing insight into global markets and the economy. Additionally, he has contributed to the development of a financial markets course approved by BankSeta (Banking Sector Education and Training Authority) at NQF level 6 in South Africa.
Latest posts by Zain Vawda (see all)
- Gold (XAU/USD) Technical Analysis: Bullish Structure Emerges - 23 December 2024
- Markets Weekly Outlook – S&P 500 in Focus as Markets Brace for Holiday Lull - 20 December 2024
- Stagflation Fears and Soaring US Yields: S&P 500’s Next Move - 19 December 2024