- Historically, the S&P 500 has shown positive seasonality in July, with an average gain of 2.3% over the past 20 years.
- Election years typically see a summer rally, followed by a dip before the election, and a post-election rally.
- Even with strong first-half performance, the S&P 500 has rarely seen negative returns in the second half. Will the rally continue?
- While past performance doesn’t guarantee future results, historical trends can be valuable for investors.
Most Read: Brent Crude – Oil eyes range breakout as $90 a barrel in focus
S&P 500 Performance in H1 2024 – Comparisons to the “Dotcom Bubble”?
The S&P 500 has experienced a stellar year-to-date performance, driven by a strong demand for AI-related investments. This enthusiasm has propelled the ‘Magnificent 7’ and several other AI-associated stocks to substantial gains, culminating in an approximate 14.4% increase in the S&P 500 index by the end of June 2024.
The index has been bolstered by a robust US economy and impressive earnings reports from US-listed companies, propelling it to record highs. To provide some context, the S&P 500 surged approximately 58% from its October 2022 lows to its June 2024 highs.
S&P 500 Top 10 Performers of 2024
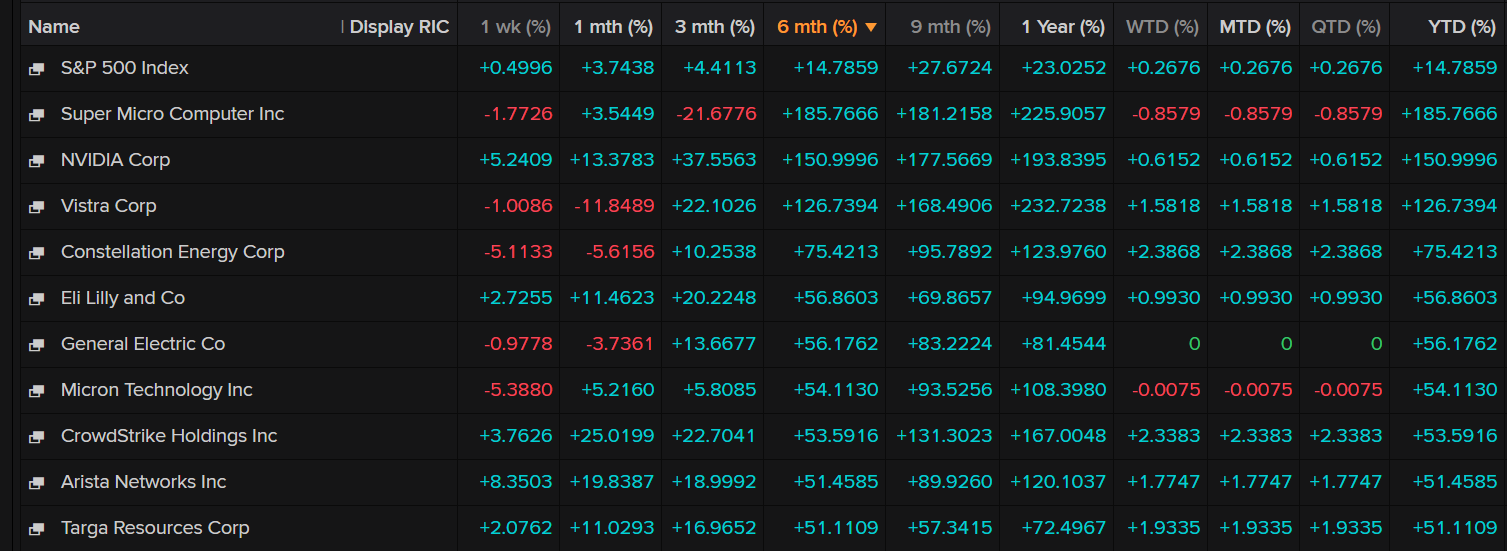
Source: LSEG (click to enlarge)
There is growing speculation among market participants, drawing comparisons between the current optimism around AI and the dotcom bubble of over 20 years ago. Many are referencing the “Four Horsemen” of the late 1990s: Cisco, Dell, Microsoft, and Intel. In particular, Cisco (CSCO) is frequently compared to the rise of AI chipmaker Nvidia (NVDA). Cisco’s stock surged 4500% in the five years leading up to its peak in 2000, a narrative similar to Nvidia’s recent ascension.
Despite the excitement, uncertainty about AI’s future persists, causing some market participants to fear a repeat of the early 2000s dotcom bubble burst. However, it’s important to note the significant differences between the two periods, most notably that today’s leading tech companies are in a much stronger financial position than their dotcom-era counterparts.
This debate is likely to continue for some time. Meanwhile, I would like to examine the seasonality and historical performance of the S&P 500 during the summer months, election years and a few other points of historical data. This data could serve as a valuable tool for anticipating market trends leading up to the upcoming US Presidential Elections.
Historical Trends: How Seasonal Patterns Influence the S&P 500
The latter half of 2024 is poised to be significant for the financial markets, with central bank policies and global elections expected to play crucial roles. Let us examine historical trends during U.S. election years and explore the seasonal patterns that influence the S&P 500.
Stock market seasonality refers to the predictable patterns or trends that occur at specific times of the year, often influenced by recurring events, investor behavior, and economic cycles. These patterns can help market participants anticipate potential market movements based on historical data.
Seasonality has provided a favorable boost for U.S. stocks in July, with the S&P 500 averaging a 2.3% gain during this month over the past 20 years. This makes July the best performing month on average over the last 20 years as well.
S&P 500 Performance Month-by-Month Since 1950
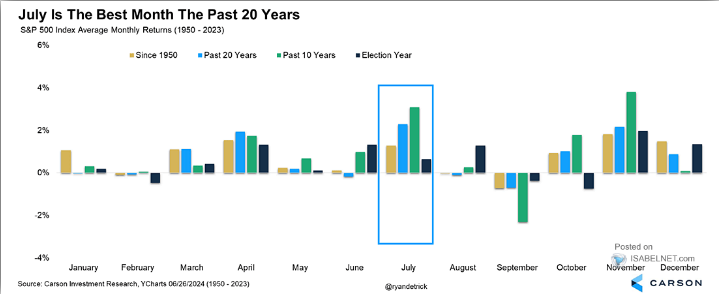
Source: Carson Investment Research, Isabelnet (click to enlarge)
The next chart examines the performance of the S&P 500 during U.S. Presidential Election years. Historical data from these years once again indicates a positive trend for July. Typically, election years exhibit a lackluster performance from January to May, followed by a summer rally that lasts until the end of August. This is usually followed by a dip in September and October leading up to the election, before a post-election rally that aligns with the “Santa Rally” heading into Christmas.
S& P500 Performance During Election Years, Monthly Returns and Percentage of Time Up – Since 1928
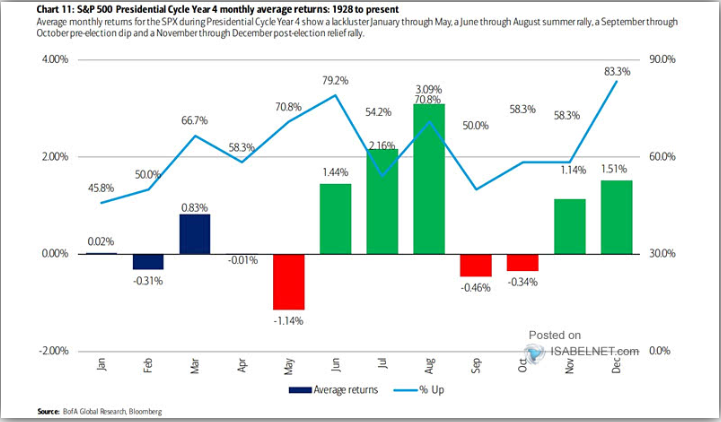
Source: BofA Research, Bloomberg and Isabelnet (click to enlarge)
Considering the remarkable performance so far in 2024, I believe the final chart is particularly relevant. The chart below illustrates the historical performance of the S&P 500 in years where gains exceeded 10% during the first six months.
Concerns have arisen that the substantial gains in the first half of the year may lead to a significant correction in the second half of 2024. However, data since 1950 shows that when the S&P 500 has increased by more than 10% in the first six months, there were only four instances where the subsequent six months resulted in negative performance
S&P 500 Performance When H1 Delivered Gains Greater than 10%
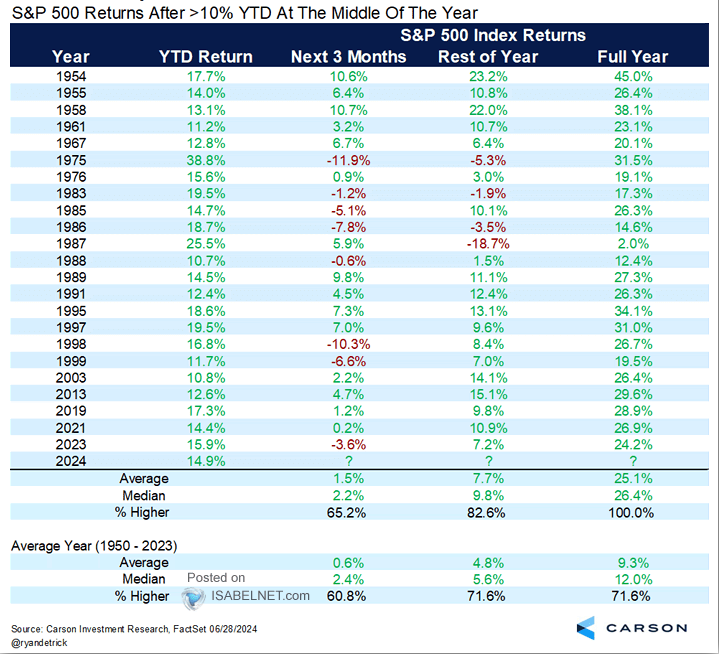
Source: Carson Research, Factset, Isabelnet (click to enlarge)
Looking at the batch historical data provided above and seasonality may well help keep the S&P 500 elevated in the second half of 2024. Of course past performance is no guarantee on future returns but seasonality and historical performance can still be a crucial tool for market participants.
There are of course unique factors this year in comparison to many others, i.e. geopolitical tension, uncertainty around monetary policy and demand/supply dynamics moving forward. All of these are somewhat unique to the current cycle but that does not mean that historical data cannot paint us a picture.
Forget the hype and the doom and gloom, use the information provided here to gain insights and assist you in making wise trading decisions as the year progresses.
For a full Technical Analysis Outlook, Read More: Markets Weekly Outlook: French, UK Elections in Focus Followed by NFP Data
Content is for general information purposes only. It is not investment advice or a solution to buy or sell securities. Opinions are the authors; not necessarily that of OANDA Business Information & Services, Inc. or any of its affiliates, subsidiaries, officers or directors. If you would like to reproduce or redistribute any of the content found on MarketPulse, an award winning forex, commodities and global indices analysis and news site service produced by OANDA Business Information & Services, Inc., please access the RSS feed or contact us at info@marketpulse.com. Visit https://www.marketpulse.com/ to find out more about the beat of the global markets. © 2023 OANDA Business Information & Services Inc.

Zain Vawda
He has spent the last 3 years in an analyst role honing his skills across various financial domains, including technical analysis, economic data interpretation, price action strategies, and analyzing the geopolitical impacts on global markets. Currently, Zain is advancing in obtaining his Capital Markets & Security Analyst (CMSA) designation through the Corporate Finance Institute (CFI), where he has completed modules in fixed income fundamentals, portfolio management fundamentals, equity market fundamentals, introduction to capital markets, and derivative fundamentals.
He is also a regular guest on radio and television programs in South Africa, providing insight into global markets and the economy. Additionally, he has contributed to the development of a financial markets course approved by BankSeta (Banking Sector Education and Training Authority) at NQF level 6 in South Africa.
Latest posts by Zain Vawda (see all)
- Gold (XAU/USD) Technical Analysis: Bullish Structure Emerges - 23 December 2024
- Markets Weekly Outlook – S&P 500 in Focus as Markets Brace for Holiday Lull - 20 December 2024
- Stagflation Fears and Soaring US Yields: S&P 500’s Next Move - 19 December 2024