- The US Dollar Index (DXY) is awaiting US inflation data (PPI and CPI), with PPI data releasing on Tuesday, January 14, and CPI on Wednesday, January 15.
- Tariff rumors from the Trump team have caused a pause in the US Dollar’s rise.
- Key support for the DXY is at 109.57, with resistance at 110.00; a break above 110.00 could signal a move towards 111.00.
Most Read: Brent Crude – Oil Advances on Russian Sanctions. Will the 100-day MA Cap Gains?
The US Dollar Index (DXY) has retreated from the psychological 110.00 handle as markets await the US inflation report due on Wednesday. Later today however, markets will get a glimpse of producer price inflation data which could set the tone for the growing 2025 inflation conundrum.
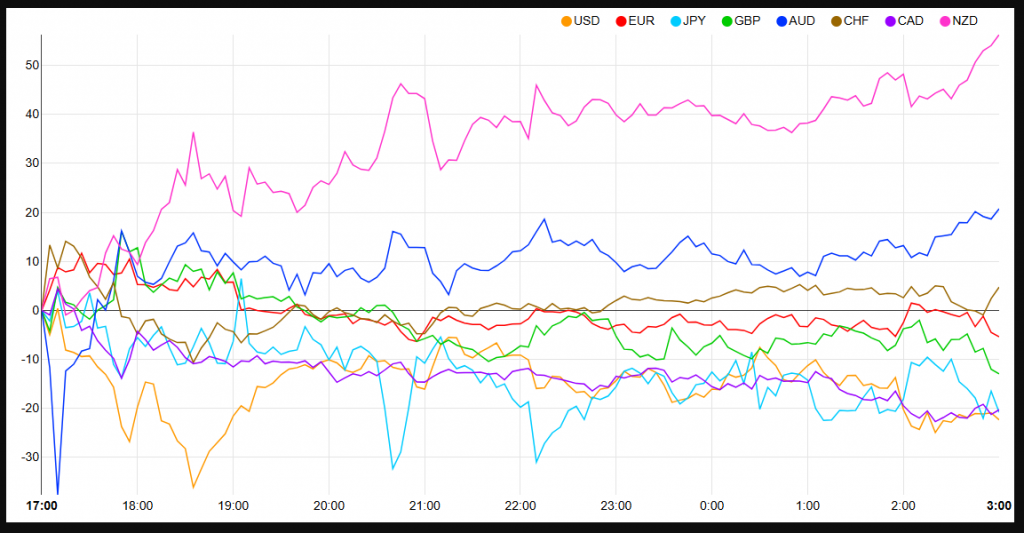
Currency Strength Chart: Strongest – NZD, AUD, CHF, EUR, GBP, CAD, JPY, USD – Weakest
Source: FinancialJuice (click to enlarge)
‘Incremental Tariff Chatter’ Leads to US Dollar Pause
The US Dollar started the week on the offensive following blockbuster payroll data on Friday. However, late in the US session rumors began to swirl that the Trump team is assessing gradual tariffs to combat the potential rise in inflation.
On Monday evening, Bloomberg reported citing sources that Donald Trump’s top economic advisers are considering slowly increasing tariffs to strengthen their negotiating position and avoid sudden inflation. A proposal being discussed involves raising tariffs by 2%-5% each month using emergency powers.
The advisers involved include Scott Bessent, nominated for Treasury Secretary, Kevin Hassett, expected to lead the National Economic Council, and Stephen Miran, chosen to head the Council of Economic Advisers. The plan has not yet been presented to Trump, showing that the idea is still in its early stages.
The news was enough however to lead a brief recovery in US stocks and lead the US Dollar Index (DXY) away from the psychological 110.00 handle.
Tariff concerns continue to support the US Dollar as fears mount around the impact it will have on US inflation. Such a move, if confirmed by incoming President Trump could pave the way for a slightly weaker US Dollar in the short-term.
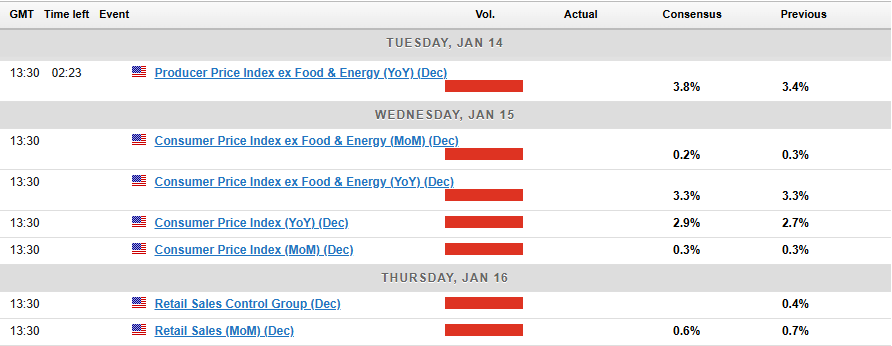
When are the US PPI and CPI Data releases?
This week will no doubt be dominated by the US PPI and CPI data releases for the month of December.
The PPI data will be released at 13h30 (GMT Time) on Tuesday, January 14 with the CPI following at the same time on Wednesday, January 15.
PPI and CPI Data in Focus
Following the US jobs report it is critical that today’s PPI data does not show significant signs of an uptick in price pressures. Increasing PPI data usually precedes a jump in consumer price inflation (CPI).
An increase prior to the impacts of potential Tariffs could send the US Dollar marching higher.
I do expect headline PPI data to come out in line with estimates but a slight uptick in core PPI (MoM) from 0.2% to 0.3% for the month of December.
Looking toward Wednesday’s CPI release, I could see a slightly milder than expected print. Markets are expecting prices to have increased 0.4% MoM but I would not be surprised with a print of 0.3%.
A slightly milder CPI print may provide some resistance to the US Dollar Index rally but this may prove to be short-lived.
There are also a couple of Fed speakers today and tomorrow which could add some extra volatility to markets. Later today we have Fed policymakers John Williams speaking at 20h00 (GMT Time) and Thomas Barkin speaking tomorrow at 13h00 (GMT Time), just before the CPI release.
For all market-moving economic releases and events, see the MarketPulse Economic Calendar. (click to enlarge)
Technical Analysis
US Dollar Index (DXY)
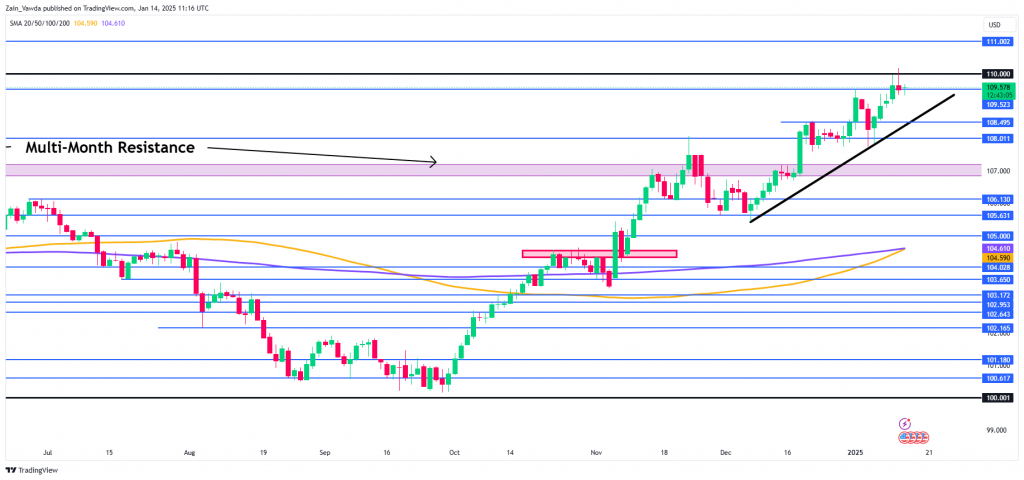
The US Dollar index daily chart has run into a key area around the 110.00 psychological level.
Yesterday tariff news coicided with a tap into the 110.00 which was met by some selling pressure and potential profit taking which also contributed to the indexes slide.
The daily candle closed as a shooting star candle which hints at further downside. We have seen a brief attempt to push lower today met by buying pressure which is a sign of the bullish momentum currently in play. This is further backed up the golden cross pattern that is forming as the 100-day MA crosses above the 200-day MA.
For now though, price is resting on support at 109.57 with a break lower likely to bring the ascending trendline into play and support at 108.49.
A move higher here for the DXY and 110.00 needs to be cleared with a daily candle close above the level a sign of acceptance. Should this occur then a run toward the 111.00 handle may be on the cards for the index.
US Dollar Index (DXY) Daily Chart, January 14, 2025
Source: TradingView.com (click to enlarge)
Support
- 109.57
- 108.49
- 108.00
Resistance
- 110.00
- 111.00
- 111.50
Follow Zain on Twitter/X for Additional Market News and Insights @zvawda
Content is for general information purposes only. It is not investment advice or a solution to buy or sell securities. Opinions are the authors; not necessarily that of OANDA Business Information & Services, Inc. or any of its affiliates, subsidiaries, officers or directors. If you would like to reproduce or redistribute any of the content found on MarketPulse, an award winning forex, commodities and global indices analysis and news site service produced by OANDA Business Information & Services, Inc., please access the RSS feed or contact us at info@marketpulse.com. Visit https://www.marketpulse.com/ to find out more about the beat of the global markets. © 2023 OANDA Business Information & Services Inc.


