- USD/CAD is rangebound, frustrating traders, thanks to a host of factors from rate differentials to rising oil prices.
- Canadian PMI data has been softer than expected, with decreased output, new orders, and employment.
- Stronger oil prices have kept the Canadian dollar supported of late.
- USD/CAD technical analysis reveals a wedge pattern, with the potential for an explosive breakout once it occurs
Most Read: S&P 500 Summer Trends: How historical seasonality could support the S&P 500
Fundamental Overview
USD/CAD continues to frustrate market participants, remaining within a roughly 250-pip range over the past three months. The ongoing tug of war between bulls and bears persists, with the potential for Central Bank divergence looming in the coming months.
The Bank of Canada (BoC) is once again leading in monetary policy. Compared to its peers, the BoC is ahead by enacting a 25 basis points rate cut at the June 5, 2024 meeting. This contrasts sharply with the U.S. Federal Reserve, where policymakers have revised their expectations to include only one rate cut for the entirety of 2024. Meanwhile, market participants are anticipating an additional three rate cuts from the BoC by year-end.
There is a case to be made that the Bank of Canada (BoC) may have acted prematurely, as recent inflation data indicates an uptick. The May inflation report showed an increase to 2.9%, up from 2.7% in April, making the July 16 inflation release highly significant. If inflation continues to rise, the BoC might find itself in a precarious position, potentially having rushed into rate cuts, just as policymakers prepare for the July Central Bank meeting.
The Canadian Dollar has benefitted from stronger oil prices of late given the correlation between the two. This may be a key factor in why USD/CAD has been stuck in a range since the beginning of April 2024.
Read More: Understanding the Relationship Between the Canadian Dollar and Oil Prices.
Let us take a closer look at the recent developments between USD/CAD and the WTI oil price. The chart below looks at the relationship between USD/CAD and WTI oil since the start of 2021.
WTI vs USD/CAD
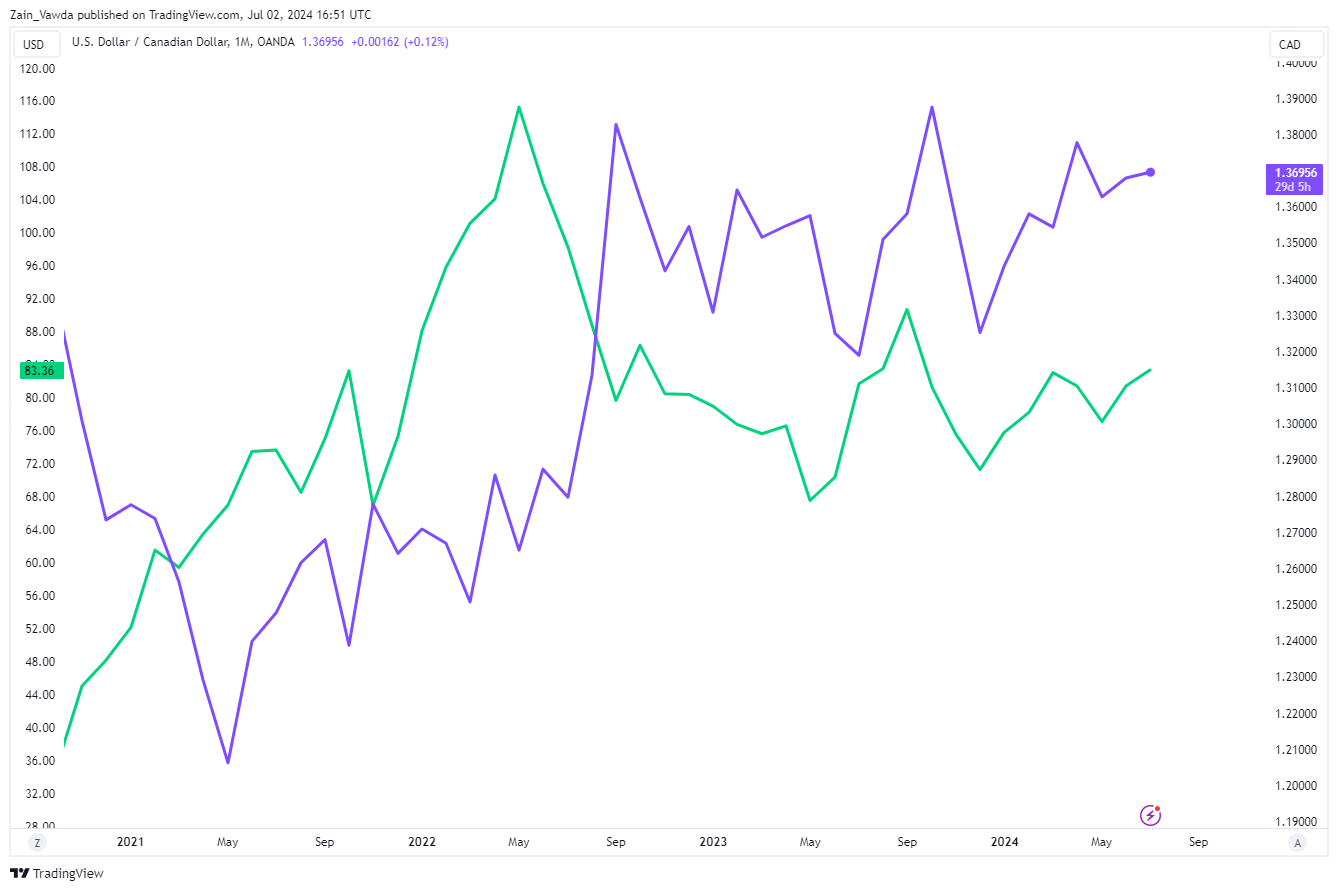
Source: TradingView.com (click to enlarge)
In general, USD/CAD moves take place after moves in WTI, with a steep rise in November 2021 followed almost immediately by a drop in the price of USD/CAD. Currently we have seen a nice rally in oil prices since the lows on May 1, around the $77 a barrel mark with USD/CAD yet to respond with a significant drop of its own. The difference here could be accounted for by the increasing probability of a rate differential in the coming months and something to pay attention to.
US and Canadian Data Releases and the Week Ahead
Earlier in the US session we had key data from both the US and Canada in the form of Jolts job openings and manufacturing PMI. Given that it is NFP week, let us look at US jolts numbers first which showed an uptick in job openings and came in higher than estimates. This is just the beginning of US jobs data this week with Friday’s NFP report likely to be key and have an impact on rate cut probabilities.
Due to mixed signals from U.S. data and policymakers, market participants are maintaining their rate cut bets for September. This is despite some policymakers indicating they foresee only one cut in the fourth quarter of this year. This back and forth and constant changes to interest rate probabilities has also kept the DXY largely rangebound over the past few months, and this looks set to continue.
Canadian PMI data came in softer than expected with another decline in both output and new orders. Canadian firms also noted a slight drop in employment (the first reduction in net staffing levels since January).
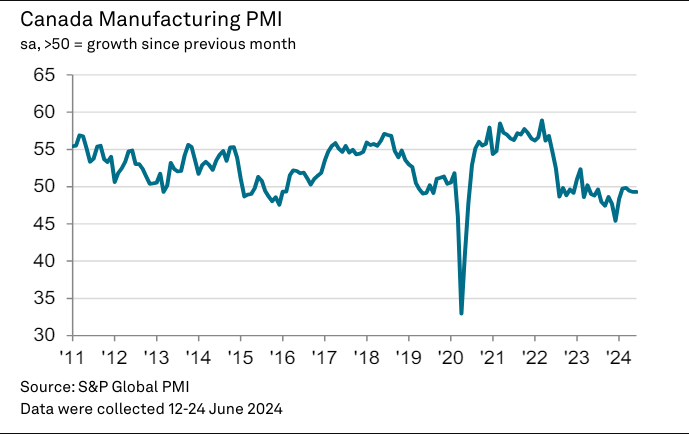
The positive from the data came in the form of price pressures, appearing broadly contained, with costs rising at a softer pace than in recent months and charges increasing only modestly. However, as noted by Paul Smith, Economics Director at S&P Global Market Intelligence, “limited pricing power is broadly a function of weak demand and a competitive marketplace, and with firms noting that prices remain too high for many clients, confidence in the future has subsequently softened to its lowest level of the year so far”. Something to ponder moving forward.
The rest of the week does bring some more high impact data, while Thursday US markets will be closed for the Independence Day holiday. This could lead to a low liquidity environment with a lot of rangebound and sideways price action. Friday of course, brings the US NFP report as well as both US and Canadian unemployment data.
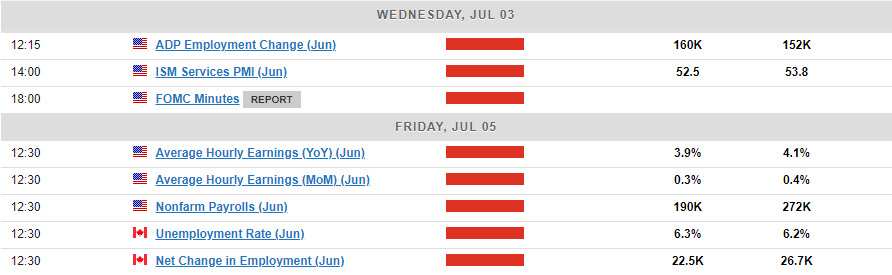
Source: For all market-moving economic releases and events, see the MarketPulse Economic Calendar. (click to enlarge)
Technical Analysis
USD/CAD has been frustrating from a price action point of view as the wedge pattern from April remains in play. The recent rally to the upside ran into resistance at the 1.3736 handle and fell just shy of the upper end of the wedge pattern.
You can see on the chart below, price has been printing higher lows and lower highs for three months.The only positive about monitoring this is that when a breakout does finally occur, it might be an explosive one (historically, the longer a currency pair or asset consolidates, the more explosive the breakout). As prices continue to compress inside the wedge pattern, a breakout will materialize which could see USD/CAD rally around 200-odd pips in the direction of the wedge breakout.
In the interim however, rangebound opportunities are being presented and the following key levels deserve to be monitored:
Support
- 1.3650
- 1.3600
- 1.3550
Resistance
- 1.3736
- 1.3790
- 1.3846
USD/CAD Daily Chart, July 2, 2024
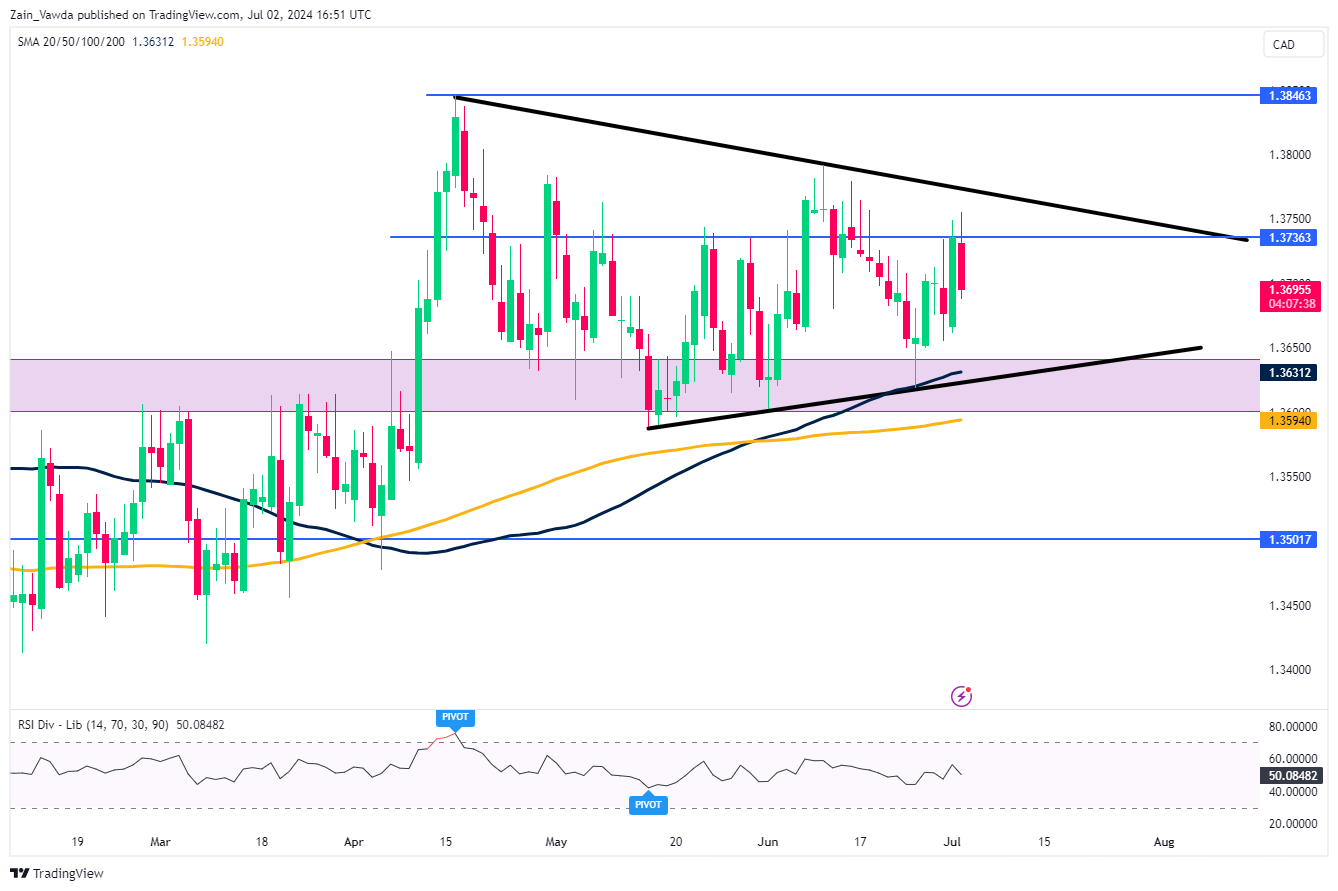
Source: TradingView.com (click to enlarge)
Content is for general information purposes only. It is not investment advice or a solution to buy or sell securities. Opinions are the authors; not necessarily that of OANDA Business Information & Services, Inc. or any of its affiliates, subsidiaries, officers or directors. If you would like to reproduce or redistribute any of the content found on MarketPulse, an award winning forex, commodities and global indices analysis and news site service produced by OANDA Business Information & Services, Inc., please access the RSS feed or contact us at info@marketpulse.com. Visit https://www.marketpulse.com/ to find out more about the beat of the global markets. © 2023 OANDA Business Information & Services Inc.

Zain Vawda
He has spent the last 3 years in an analyst role honing his skills across various financial domains, including technical analysis, economic data interpretation, price action strategies, and analyzing the geopolitical impacts on global markets. Currently, Zain is advancing in obtaining his Capital Markets & Security Analyst (CMSA) designation through the Corporate Finance Institute (CFI), where he has completed modules in fixed income fundamentals, portfolio management fundamentals, equity market fundamentals, introduction to capital markets, and derivative fundamentals.
He is also a regular guest on radio and television programs in South Africa, providing insight into global markets and the economy. Additionally, he has contributed to the development of a financial markets course approved by BankSeta (Banking Sector Education and Training Authority) at NQF level 6 in South Africa.