- Stalling at $1,960
- Key fib levels remain a big test
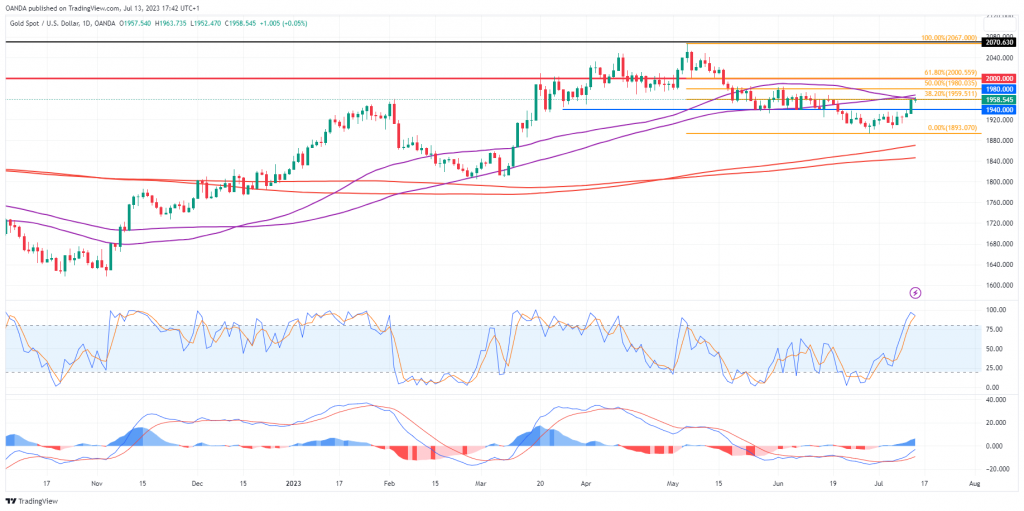
Gold is also trading marginally higher today and struggling around a notable resistance level, $1,960.
It broke through $1,940 yesterday on the back of the inflation numbers and has now entered retracement territory where a few key levels will be put to the test.
From a technical standpoint, those are the 38.2%, 50%, and 61.8% Fibonacci retracement levels – May highs to June lows – which happen to fall around $1,960, $1,980, and $2,000, respectively.
Gold Daily
Source – OANDA on Trading View
A break of these may indicate that gold is back in bullish territory, although the price may face some resistance in the interim.
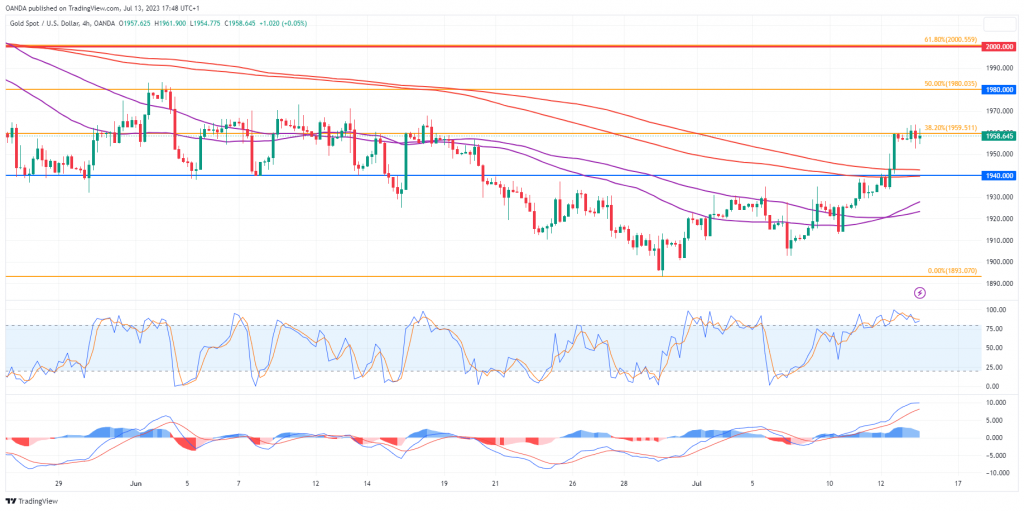
A look at the 4-hour chart supports the more bullish view in gold but there is scope for corrective moves along the way. We’ve seen some consolidation since breaking $1,940 – which also saw the price break above the 200/233-period simple moving average band. Price has been quite responsive to this in the past.
If the price does pull back a little, it will be interesting to see whether it tests $1,940 from above, with a rotation off here viewed to be confirmation of the initial breakout and a bullish signal. Especially with it coinciding with that SMA band.
Gold 4-Hour
Source – OANDA on Trading View
Content is for general information purposes only. It is not investment advice or a solution to buy or sell securities. Opinions are the authors; not necessarily that of OANDA Business Information & Services, Inc. or any of its affiliates, subsidiaries, officers or directors. If you would like to reproduce or redistribute any of the content found on MarketPulse, an award winning forex, commodities and global indices analysis and news site service produced by OANDA Business Information & Services, Inc., please access the RSS feed or contact us at info@marketpulse.com. Visit https://www.marketpulse.com/ to find out more about the beat of the global markets. © 2023 OANDA Business Information & Services Inc.


