- Eurozone HICP inflation y/y 4.3% in September (5.2% in August), core HICP 4.5% (5.3%)
- US PCE inflation y/y 3.5% in August (3.4% in July), core PCE 3.9% (4.3%)
- DAX rebounds but remains below key technical level
European stock markets are performing well at the end of the week after spending much of it in the red on the back of fresh interest rate concerns.
A determination to drive home the message that interest rates will stay higher for longer appears to have finally wobbled investors. Today’s HICP inflation figures from the eurozone will have come as a big relief against that backdrop which may explain why we’re ending the week on a high.
A beat at both the headline and core levels puts the eurozone in a promising position, especially with both expected to fall much more over the next couple of months, at which point investors may well start demanding more rate cut debate at the ECB. Not that I think policymakers will even entertain that idea any time soon.
Recent trend is promising for US inflation
Talking of positive surprises, the US PCE inflation numbers weren’t bad either. The monthly reading fell unexpectedly to 0.4% while at the core level, it was also lower at 0.1%. The annual readings may have been in line but that’s extremely promising as far as recent trends are concerned. With data over the coming weeks likely to be disrupted, this certainly feels like it falls in the pause category for the Fed at the next meeting.
DAX testing key technical level
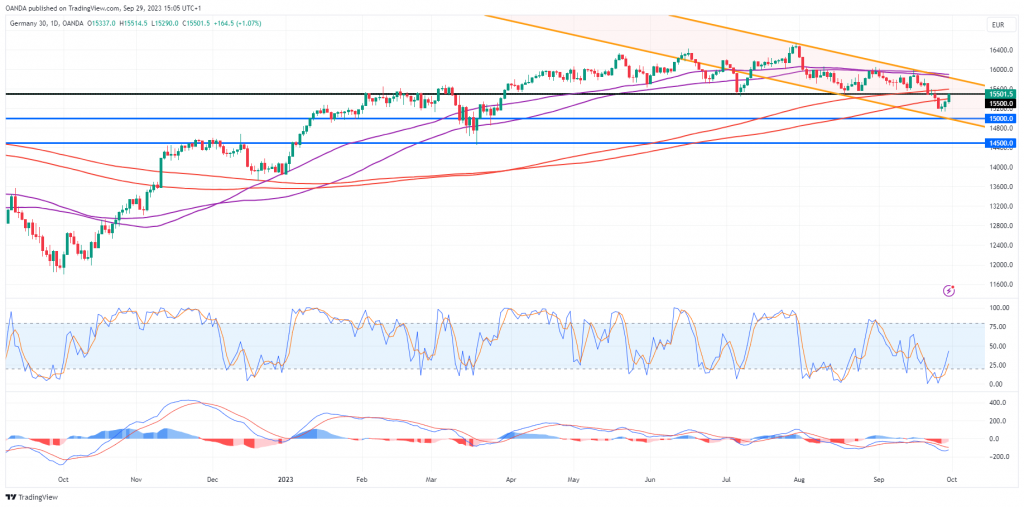
The DE30 broke below the 200/233-day simple moving average band earlier this week and following the inflation data, it’s now retesting it from below.
DE30 Daily
Source – OANDA on Trading View
A move back above could potentially be viewed as a bullish signal while a rebound lower from here could be very bearish. This would be confirmation of the break of the SMA band as well as the 15,500 level that was previously a key area of support.
The index remains in the declining channel and the next test below could come around 15,000 where the channel combines with a prior level of support and resistance.
The break lower this week didn’t happen suddenly, it’s been building for weeks, as is evident in the index running into repeated resistance around the 55/89-day SMA band before breaking below the 200/233 band. A move back above the 55/89 would be a very bullish signal and could suggest sentiment is on the mend.
Content is for general information purposes only. It is not investment advice or a solution to buy or sell securities. Opinions are the authors; not necessarily that of OANDA Business Information & Services, Inc. or any of its affiliates, subsidiaries, officers or directors. If you would like to reproduce or redistribute any of the content found on MarketPulse, an award winning forex, commodities and global indices analysis and news site service produced by OANDA Business Information & Services, Inc., please access the RSS feed or contact us at info@marketpulse.com. Visit https://www.marketpulse.com/ to find out more about the beat of the global markets. © 2023 OANDA Business Information & Services Inc.


