Hang Seng Index: Improvement in market breadth and southbound flows, the bull run may not be over
- Hang Seng Index component stocks that are trading above their respective 200-day moving averages have increased steadily in the past three months.
- A positive net inflow trend from mainland China investors and traders has developed toward the Hong Kong stock market.
- China Caixin Services PMI has continued to advance in May which reduces the odds of the deflationary risk spiral being entrenched in China.
- Watch the 17,110 key medium-term pivotal support on the Hang Seng Index.
This is a follow-up analysis of our prior report, “Hang Seng Index: Oversold-led positive animal spirits overshadowed currency war risk” dated 10 May 2024. Click here for a recap.
Since April’s stellar performance that yielded a monthly positive return of 7.39% for the Hang Seng Index together with a similar feat seen in the Hang Seng TECH Index (+6.42%) and Hang Seng China Enterprises Index (+7.97) that outperformed the US S&P 500 (-4.16%) and the rest of the world; MSCI All Country World Index (-3.55%), fortunes have reversed in May.
The Hang Seng Index only managed to squeeze out a meagre monthly return of 1.78% by the end of May (down from an intra-monthly high-water mark return of 10.94%) which underperformed the S&P 500 (+4.80%) and the MSCI All Country World Index (+4.58%) in May.
Has the bull run ended for the Hang Seng Index?
Market breadth has improved for the Hang Seng Index
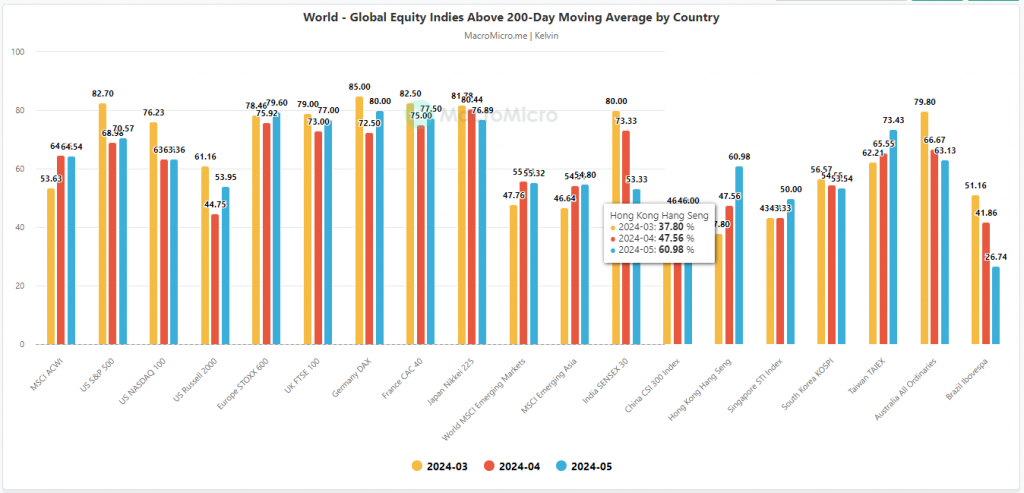
Fig 1: Global stock indices market breadth gauges as of end-May 2024 (Source: MacroMicro, click to enlarge chart)
Using the 200-day moving average as a gauge to evaluate the status of a major trend phase, we examine the number of component stocks expressed in percentages in the Hang Seng Index that are traded above their respective 200-day moving averages; an indication of firmer major uptrend phase if more component stocks are trading above their 200-day moving averages.
Since March 2024, the percentage of Hang Seng Index component stocks above their respective 200-day moving average stood at 37.80% and has gradually increased in the following two months; April (47.56%), and May (60.98%). A similar positive observation albeit at a shallower magnitude can be seen in the China CSI 300 Index; March (39.33%), April (46%), and May (46%) (see Fig 1).
China’s southbound fund inflows have trended higher since the end of May
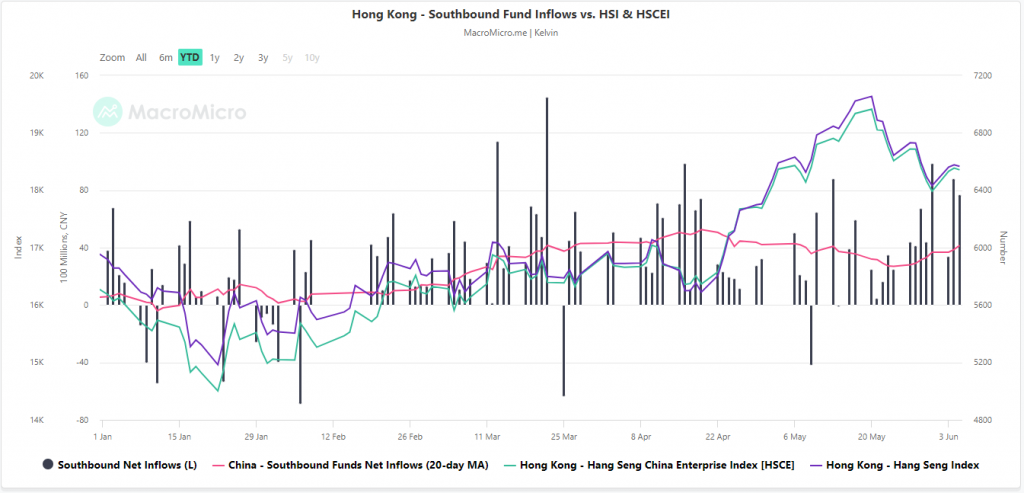
Fig 2: China southbound net inflows with HSI & HSCEI as of 5 Jun 2024 (Source: MacroMicro, click to enlarge chart)
China/onshore investment bound for Hong Kong equities goes through the Shanghai and Shenzhen-Hong Kong Stock Connect Programmes. The total flows from these two programmes are known as the southbound fund flows.
A rising positive trend of southbound net inflows indicates that mainland China investors and traders are likely optimistic about the outlook of the Hong Kong stock market, hence in general fueling positive momentum into the Hang Seng Index which moves almost in line with the trend of the southbound funds’ net inflows.
The trend of southbound net inflows has started to move higher since 27 May 2024 as indicated by its rising 20-day moving average (see Fig 2) which suggests growing confidence and optimism toward Hong Kong equities.
Macro data has improved in China
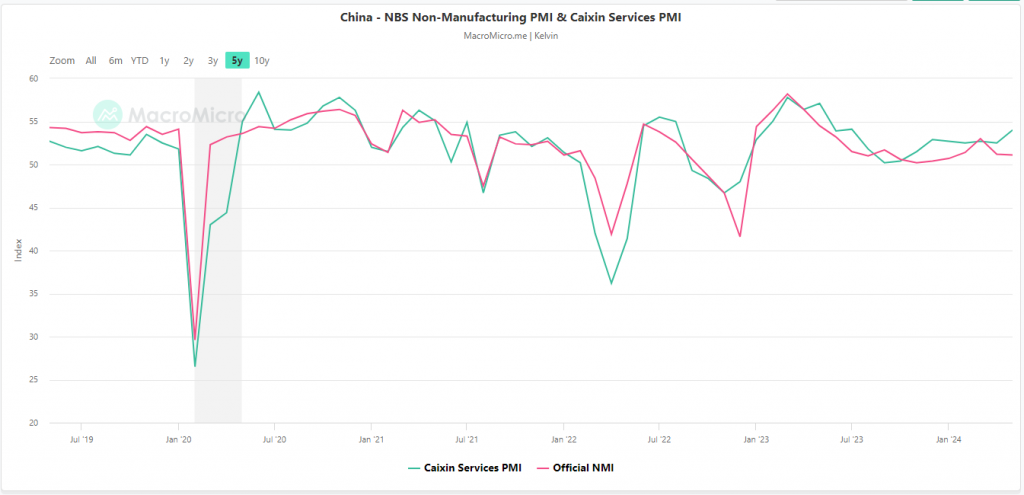
Fig 3: China NBS Non-Manufacturing PMI & Caixin Services PMI for May 2024 (Source: MacroMicro, click to enlarge chart)
The latest data from China Caixin Services Purchasing Managers’ Index PMI represents private small and medium enterprises (in contrast with the official NBS Non-Manufacturing PMI that consists of large state-owned enterprises) that have been on a path of stable expansion since October 2023; it advanced to 54.0 in May from 52.5 printed in April, beating forecasts of 52.6, and recorded its fastest pace of expansion since July 2023 (see Fig 3).
In addition, its new business and new export orders (sub-components of the China Caixin Services PMI) for May grew the most in a year due to strengthening domestic and external demand.
This latest set of positive macro data suggests the piecemeal stimulus measures from China’s top policymakers are working to negate the deflationary risk spiral that has been triggered by the significant slowdown inherent in the domestic property market.
Hang Seng Index has retraced towards its rising 50-day moving average
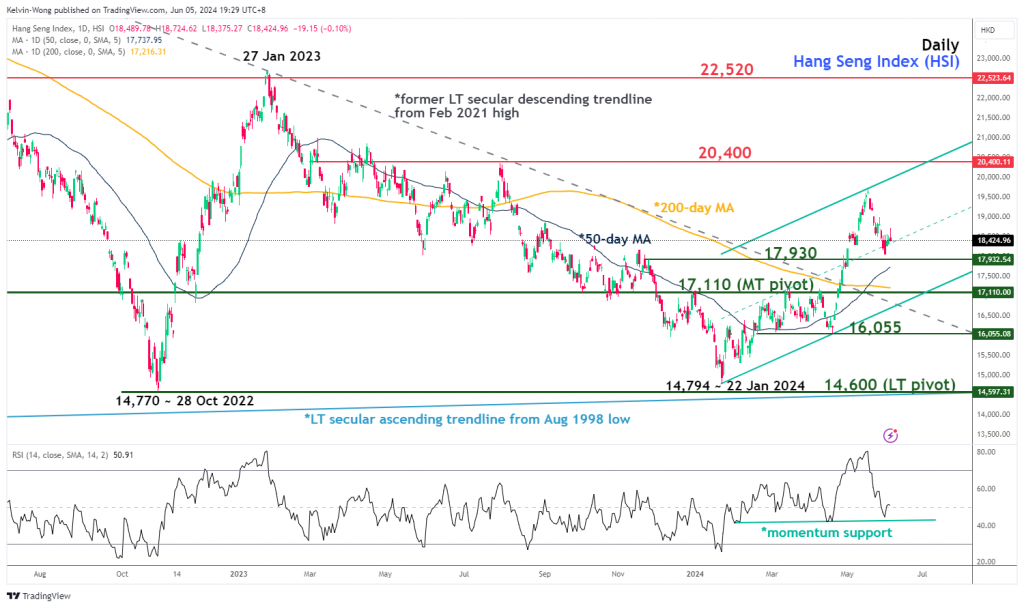
Fig 4: Hang Seng Index medium-term trend as of 5 Jun 2024 (Source: TradingView, click to enlarge chart)
The recent two weeks of 8.3% decline from its 20 May 2024 high of 19,706 in the Hang Seng Index has almost reached the 50-day moving average that is acting as an intermediate support at around 17,930.
In addition, the daily RSI momentum indicator has managed to stage a bounce right above a parallel key support at the 42 level which suggests that medium-term bullish momentum may have resurfaced (see Fig 4).
Watch the 17,110 key medium-term pivotal support (also close to the 200-day moving average) to maintain the current medium-term uptrend phase for the next medium-term resistance to come in at 20,400 (also the upper boundary of the ascending channel in place since the 22 January 2024 low).
However, a breakdown with a daily close below 17,110 damages the medium-term uptrend phase to expose the next medium-term support at 16,055 in the first step.
Content is for general information purposes only. It is not investment advice or a solution to buy or sell securities. Opinions are the authors; not necessarily that of OANDA Business Information & Services, Inc. or any of its affiliates, subsidiaries, officers or directors. If you would like to reproduce or redistribute any of the content found on MarketPulse, an award winning forex, commodities and global indices analysis and news site service produced by OANDA Business Information & Services, Inc., please access the RSS feed or contact us at info@marketpulse.com. Visit https://www.marketpulse.com/ to find out more about the beat of the global markets. © 2023 OANDA Business Information & Services Inc.


