- Short-term positive animal spirits have resurfaced in China and Hong Kong stock markets stoked by additional liquidity injection from PBoC and the creation of a “stabilization fund”.
- Long-term prospects are still dim as a liquidity trap scenario cannot be ruled out in the real economy due to weak consumer and business sentiment.
- Watch the next intermediate resistances at 16,525 and 17,130 on the Hang Seng Index,
This is a follow-up analysis of our prior report, “Easing liquidity conditions may provide interim support for China and Hong Kong stock markets” dated 11 January 2024. Click here for a recap.
“Desperate times, calling for desperate measures” as China’s top policymakers are trying to stall the continuation of the horrendous decline seen in the China and Hong Kong stock markets since the start of the new year reinforced by China Premier Li Qiang’s speech in Davos last week that implied that China leadership is comfortable with the current pace of growth trajectory in China which in turn has dampened hopes of more forceful fiscal and monetary stimulus measures in 2024.
At the start of this week, the China and Hong Kong benchmark stock indices extended their losses with a decline of -2.3% seen on the Hang Seng Index, almost hitting the October 2022 low.
Additional liquidity injection from PBoC
Thereafter, a slew of stimulative policies has been announced in the past two days; the step-up progress of the establishment of a 2 trillion yuan “stabilization fund” to prop up China equities, and the upcoming 50 basis points cut on China’s major banks’ reserve requirement ratio (RRR) on 5 February before the Lunar New Year holidays; the steepest single RRR cut implementation in the past two years.
China and Hong Kong equities have managed to see a minor positive turnaround since Tuesday, 23 January as the CSI 300 has gained by +2.7% with the Hang Seng Index (+5.2%), Hang Seng TECH Index (+5%), and Hang Seng China Enterprises Index (+5.9%) triggered by the return of short-term positive animal spirits and possible short covering activities as a media outlet reported yesterday that China’s securities regulator had asked some hedge fund managers to restrict short selling via the stock index futures.
Potential countertrend rebound sequences in progress
In the short term from a technical analysis perspective, the China and Hong Kong benchmark stock indices may see a series of countertrend rallies within their respective major downtrend phases as all of them are still trading below their respective key 200-day moving averages. Also, their current year-to-date performances are still reflecting losses at this time of the writing; CSI 300 (-3.3%), Hang Seng Index (-5.1%), Hang Seng TECH Index (-12%), and Hang Seng China Enterprises Index (-5.3%).
A liquidity trap scenario cannot be ruled out
In a longer-term perspective, there is still no clarity at this juncture to indicate that China and Hong Kong benchmark stock indices have hit major bottoming inflection points as additional liquidity injections need to be accompanied by fiscal stimulus policies (direct subsidies) that can directly trigger a boost to consumer and business sentiment that is causing the crux of this ongoing deflationary risk spiral in China.
Hence, additional liquidity created in the banking system without an uptick in consumer & business sentiment (demand-pull effect) may lead to a lack of demand for bank loans which can create a “liquidity trap” scenario in China that reinforces the current deflationary risk spiral.
Watch the next intermediate resistances at 16,525 and 17,130
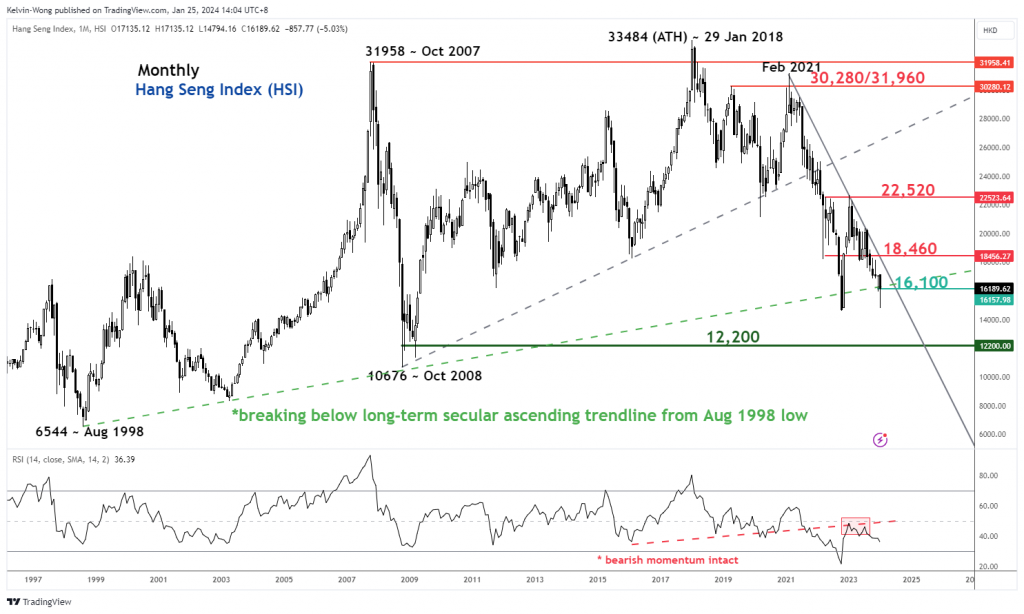
Fig 1: Hang Seng Index long-term secular trend as of 25 Jan 2024 (Source: TradingView, click to enlarge chart)
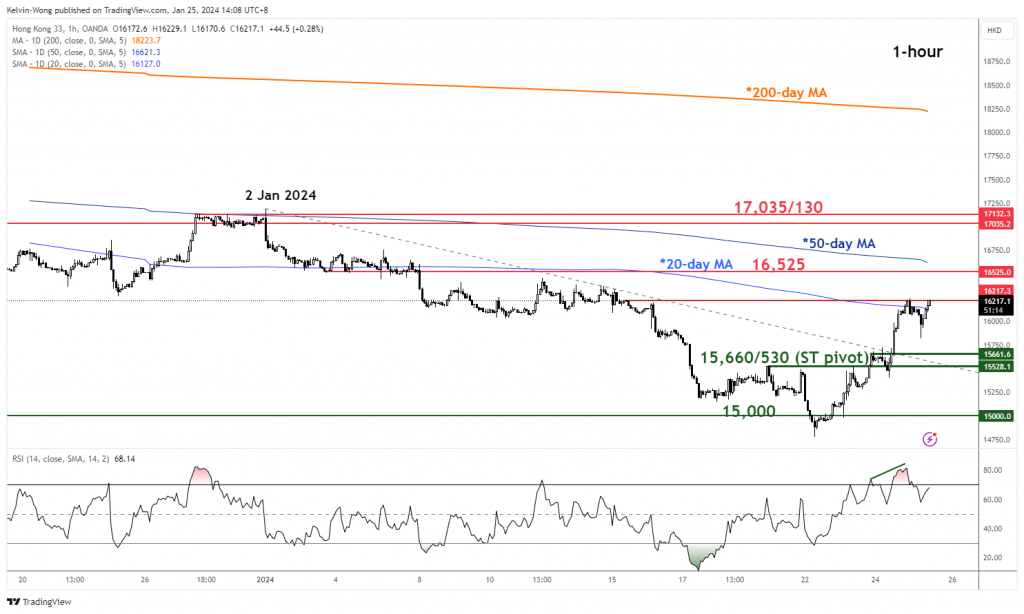
Fig 2: Hang Seng Index minor short-term trend as of 25 Jan 2024 (Source: TradingView, click to enlarge chart)
Current price actions of the Hang Seng Index are now attempting to reintegrate back above the 16,100 key long-term pivotal support (also the ascending trendline in place since the August 1998 Asian Financial Crisis low).
In the shorter term as depicted by the hourly chart, there are positive elements to support a further potential extension of the ongoing countertrend rebound, the Index has staged a bullish breakout above its minor descending trendline from the 2 January 2024 high and the hourly RSI momentum indicator is still exhibiting positive configuration without a bearish divergence condition at its overbought region.
Watch the 15,660/530 key short-term pivotal support with the next intermediate resistances coming in at 16,525 and 17,035/130 (also close to the 38.2% Fibonacci retracement of the major downtrend from the 31 July 2023 high to 22 January 2024 low).
However, failure to hold at 15,530 invalidates the bullish tone to expose the next intermediate support at 15,000.
Content is for general information purposes only. It is not investment advice or a solution to buy or sell securities. Opinions are the authors; not necessarily that of OANDA Business Information & Services, Inc. or any of its affiliates, subsidiaries, officers or directors. If you would like to reproduce or redistribute any of the content found on MarketPulse, an award winning forex, commodities and global indices analysis and news site service produced by OANDA Business Information & Services, Inc., please access the RSS feed or contact us at info@marketpulse.com. Visit https://www.marketpulse.com/ to find out more about the beat of the global markets. © 2023 OANDA Business Information & Services Inc.


