- China’s negative import growth in November suggests a sticky weak domestic demand environment.
- China and Hong Kong stock markets have failed to reignite bullish animal spirits despite the weakening trend seen in the US 10-year Treasury yield in the past month.
- Hang Seng Index now faces a potential major bearish breakdown that may retest the 12,200 October 2008 GFC swing low area in Q1 2024.
This is a follow-up analysis of our prior report, “Deflationary spiral is still a recurring risk in China, but the yuan remains resilient” published on 30 November 2023. Click here for a recap.
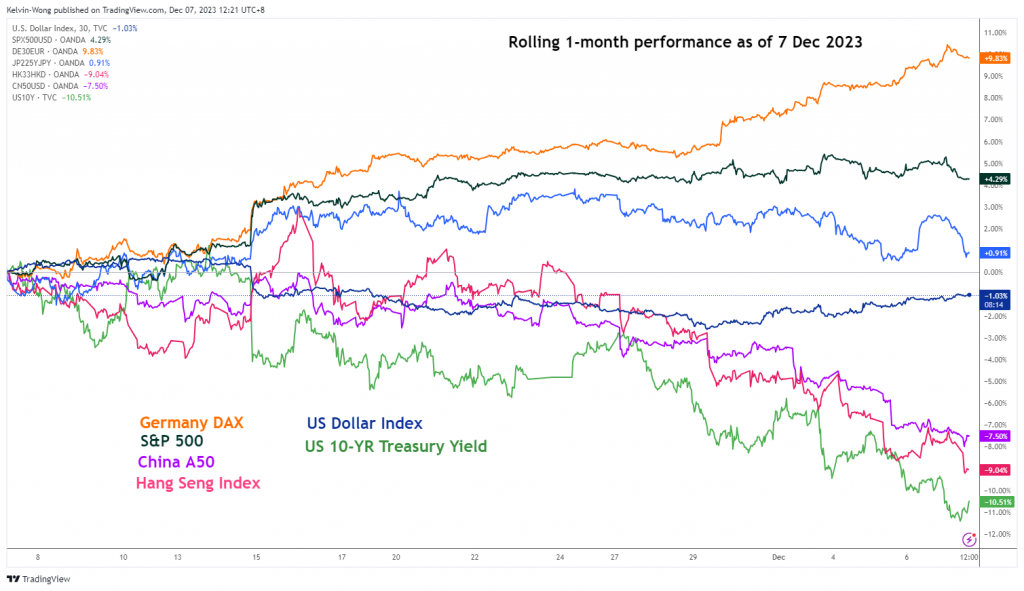
China and Hong Kong stock markets have continued to wobble despite the recent one-month of risk-on-herding behaviour seen in other global stock markets triggered by the medium-term downtrend phases of the US 10-year Treasury yield and US dollar weakness (see Fig 1).
Underperformance of China & Hong Kong benchmark stock indices
Fig 1: Rolling 1-month performances of global benchmark stock indices with US Dollar Index & US 10-year Treasury yield as of 7 Dec 2023 (Source: TradingView, click to enlarge chart)
The month of November 2023 has witnessed stellar monthly performances in the S&P 500 (+8.9%), Germany DAX (+9.5%), Nikkei 225 (+8.5%), and MSCI Emerging Markets ex China (+9.7%). In contrast, bears dominated China A50 (2%), CSI 300 (-2.1%), and Hang Seng Index (-0.4%) over the same period.
The persistent weakness seen in the China and Hong Kong stock markets since China’s COVID re-opening optimism fizzled out in Q1 2023 has been primarily driven by structural vulnerabilities due to rising debt risks in major property developers that may trigger a deflationary spiral in China.
Domestic demand has also remained lacklustre in China despite ongoing revival efforts by policymakers via targeted monetary and fiscal stimulus measures. The latest trade data for November has indicated a surprise contraction in China’s imports which slipped to -0.6% y/y, below consensus estimates of a further improvement in growth to 3.3% y/y from 3% recorded in October.
Hence, it seems that the prior one-month recovery of import growth recorded in October is likely a “blip” and November’s negative y/y growth rate suggests the rolling twelve months of negative growth trend in imports remains intact.
Hang Seng Index faces the risk of a major bearish breakdown
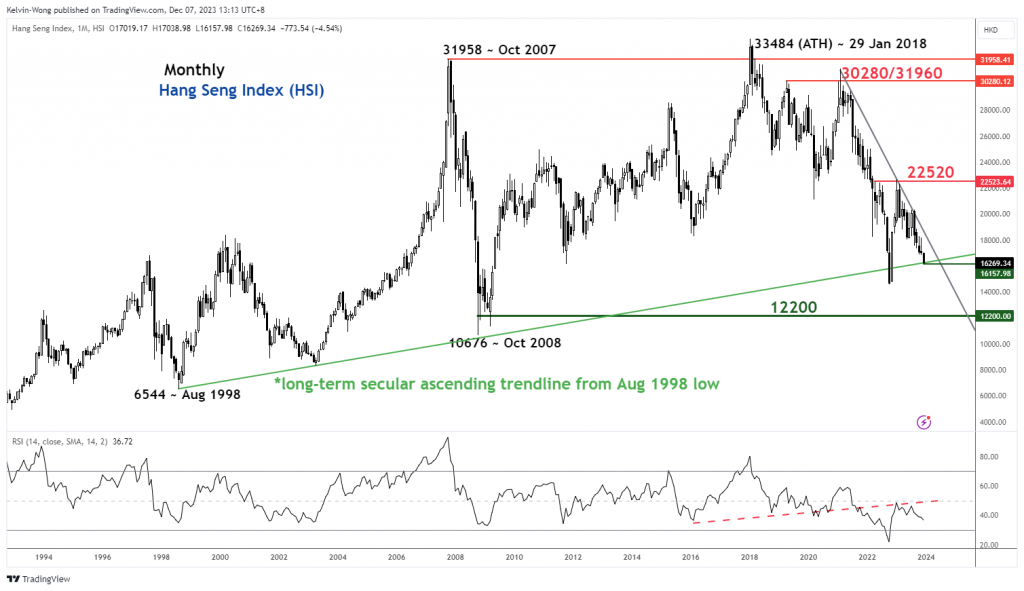
Fig 2: Hang Seng Index long-term secular trend as of 7 Dec 2023 (Source: TradingView, click to enlarge chart)
Through the lens of technical analysis, bearish momentum readings have been flashed out in the long-term monthly chart of the Hang Seng Index.
It is now retesting a long-term secular ascending support in place since the major August 2028 low (Asian Financial Crisis), the last retest and rebound occurred on October 2022 in line with China’s COVID re-opening theme play that coincided with an extremely oversold reading of 21.90 seen in monthly RSI momentum indicator.
In contrast, the current retest on the long-term secular ascending trendline now acting as support at around 16,100 has not been accompanied by bullish reading seen in the monthly RSI indicator; not in the oversold region at this juncture, and bearish momentum remains intact as it traced out a lower high right below a parallel resistance at the 50 level.
Therefore, the Hang Seng Index may see further potential weakness in Q1 2024 with the next major support coming in at 12,200 (October 2008 GFC swing low area & the lower limit of a major sideways range configuration in place since October 2007 major swing high).
Watch the 16,680 key short-term resistance
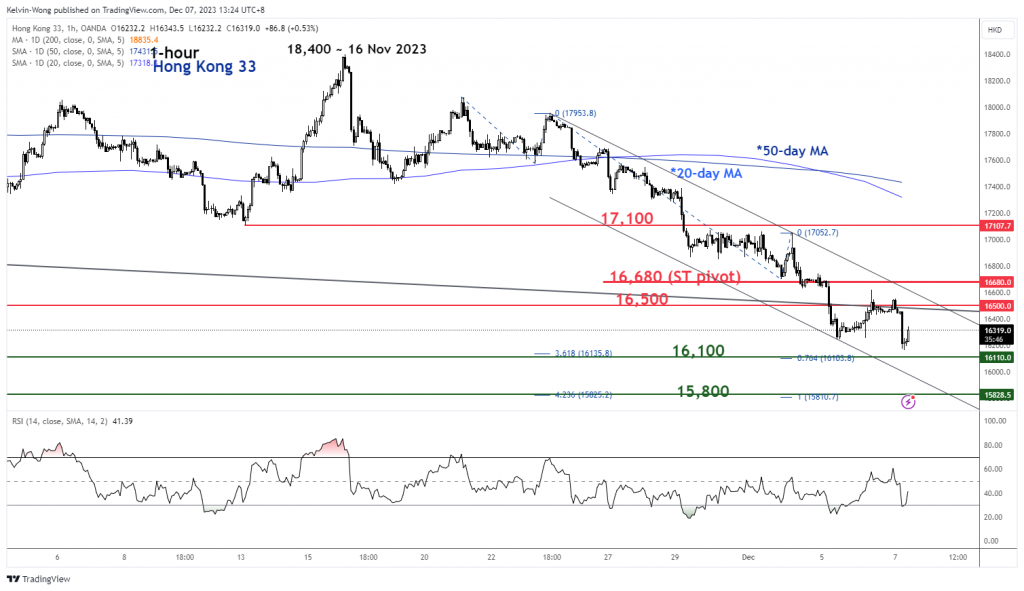
Fig 3: Hong Kong 33 minor short-term trend as of 7 Dec 2023 (Source: TradingView, click to enlarge chart)
Based on the shorter-term hourly chart, the price actions of the Hong Kong 33 Index (a proxy of the Hang Seng Index futures) are still evolving within a minor downtrend phase in place since the 16 November 2023 high of 18,400.
Key short-term pivotal resistance will be at 16,680 (also the upper boundary of the minor descending channel). A breakdown below 16,100 exposes the next near-term support at 15,800 (lower boundary of the minor descending channel & Fibonacci extension cluster) in the first step.
On the flip side, a clearance above 16,680 negates the bearish tone for a potential minor counter-trend rebound towards 17,100 intermediate resistance (also close to the downward-sloping 20-day moving average).
Content is for general information purposes only. It is not investment advice or a solution to buy or sell securities. Opinions are the authors; not necessarily that of OANDA Business Information & Services, Inc. or any of its affiliates, subsidiaries, officers or directors. If you would like to reproduce or redistribute any of the content found on MarketPulse, an award winning forex, commodities and global indices analysis and news site service produced by OANDA Business Information & Services, Inc., please access the RSS feed or contact us at info@marketpulse.com. Visit https://www.marketpulse.com/ to find out more about the beat of the global markets. © 2023 OANDA Business Information & Services Inc.


