- The market seems to be focused now on growth-related macro data rather than inflation risk.
- Another softer US retail sales may spark another recession aka hard-landing fear.
- The rise of the VVIX / VIX ratio may see another potential spike in the VIX.
- Watch the 19,230 key short-term resistance on the Nasdaq 100.
In July, the Nasdaq 100 was the worst-performing benchmark US stock indices where it recorded a monthly loss of -1.6% versus the S&P 500 (+1.1%), Dow Jones Industrial Average (+4.4%), and Russell 2000 (+10%).
In addition, the global synchronized risk-off behaviour that took shape in the past three weeks led to a larger drawdown in the Nasdaq 100 versus other US stock indices as it plummeted by -16% from its July high to 5 August 2024 low as momentum-driven strategies trimmed their long positions on US mega-cap technology stocks that have a significant combined weightage in the Nasdaq 100.
Since the climatic sell-off seen in global stock indices on Monday, 5 August, the implied volatility of the S&P 500, the VIX has declined from a 52-week high of 65.73 to 16.20 on Wednesday, 14 August has led to a return of risk appetite; the Nasdaq 100 rebounded by 9% so far from its 5 August low.
However, at least in the short term, three factors may pause the current rally seen in the Nasdaq 100.
The hard landing scenario alarm bell may ring again if US retail sales disappoint
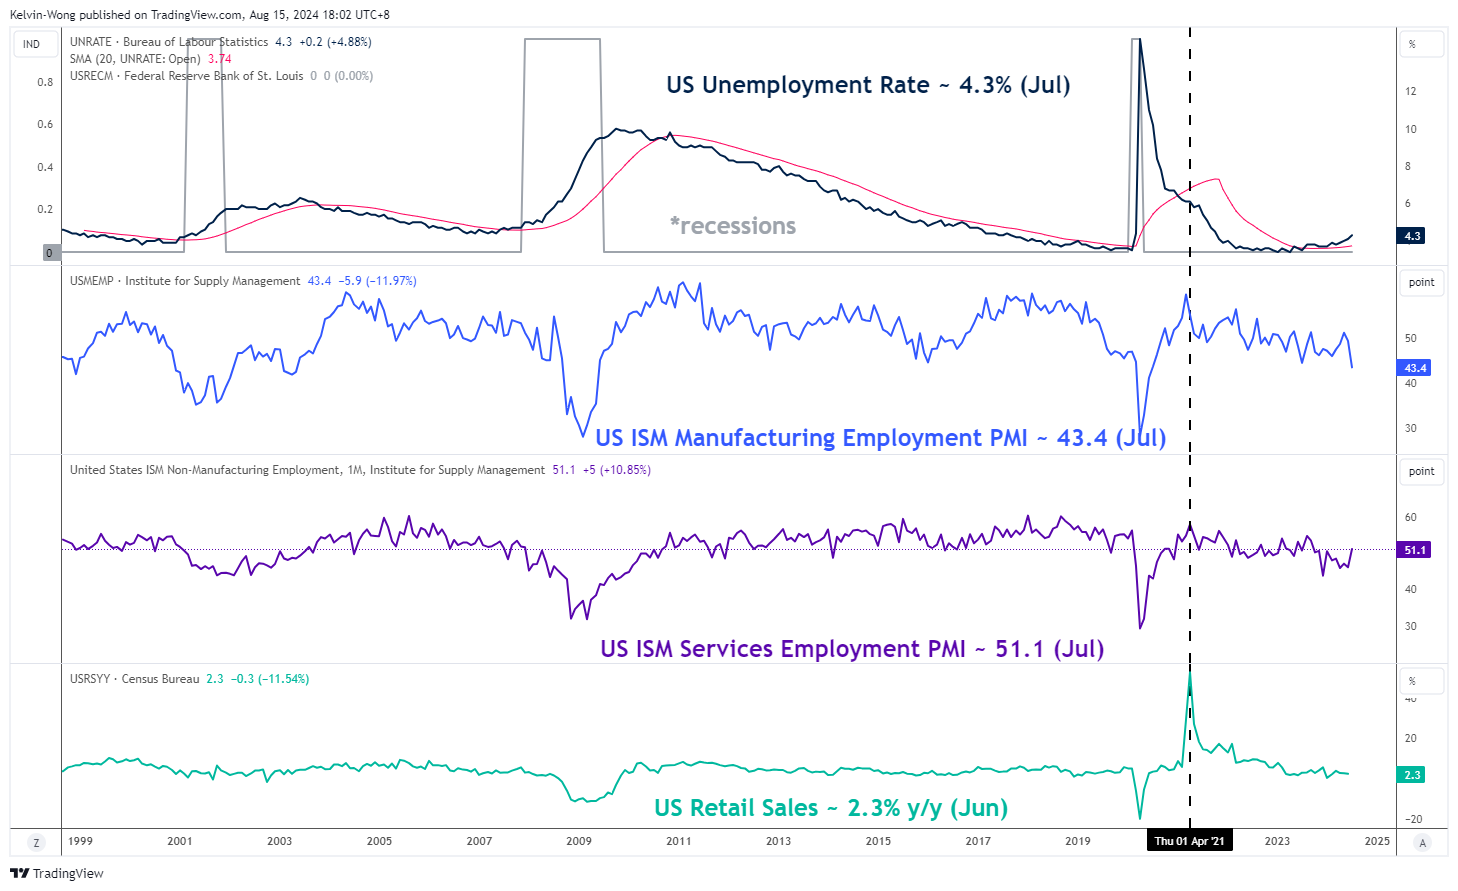
Fig 1: US Unemployment Rate, ISM Manufacturing/Services Employment PMI & Retail Sales trends (Source: Trading View, click to enlarge chart)
Despite a soft July US CPI print released on Wednesday, 15 August that indicated the inflationary trend in the US continued its deceleration path, it did not yield its prior positive impact on the Nasdaq 100 as the Nasdaq 100 underperformed (almost unchanged) versus the S&P 500 (+0.38%).
Hence, the market seems to be more focused on economic growth-related macro data now rather than inflation risk due to the fear of a US recession or hard-landing scenario that may be already in motion with the US Federal Reserve being late on embarking its interest rate cut cycle.
The next key US growth-focused data will be retail sales for July which is out later today; so far it has been on a path of slower growth since the March print of 3.6%, if the July number comes in lower than the 2.3% y/y recorded in June, it will be the fourth consecutive month of a growth slowdown in consumer spending which may bring the recession aka hard-landing scenario in the US back to the forefront again.
The volatility of implied volatility (VVIX) is falling at a slower pace
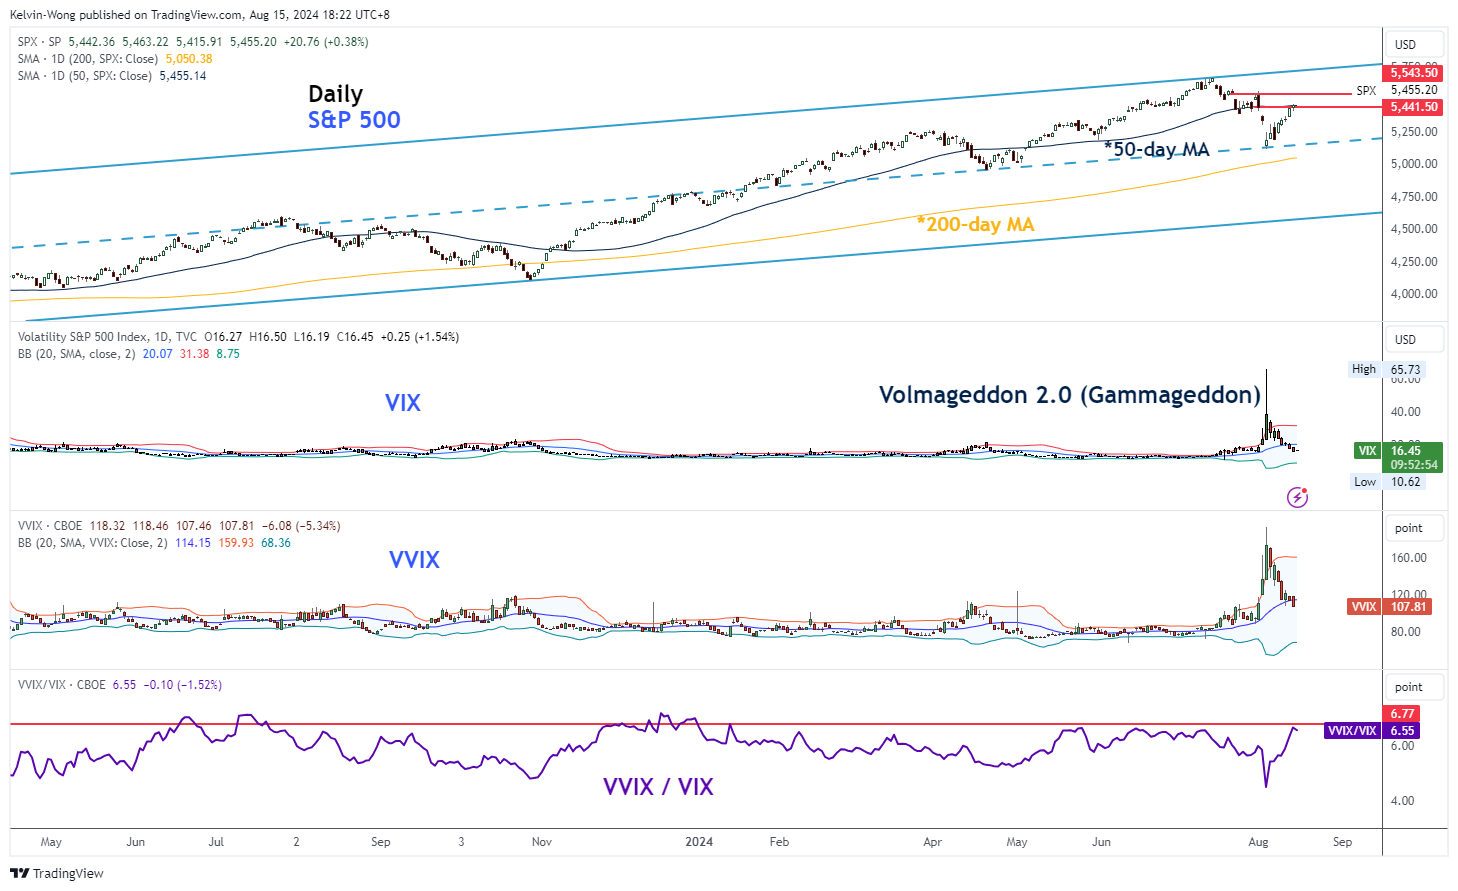
Fig 2: VVIX & VIX medium-term trends as of 15 Aug 2024 (Source: Trading View, click to enlarge chart)
In the past two weeks since 5 August, the implied volatility of the S&P 500 (VIX) has fallen but the pace of the higher-order implied volatility of the VIX (VVIX) has declined at a slower pace than the VIX.
Therefore, the VVIX / VIX ratio has increased since 5 August which suggests that there is still a degree of uncertainty in the US stock market. Right now, the VVIX / VIX ratio is at 6.59 at this time of the writing, just a whisker away from a significantly high level of 6.77 that led to past multi-week and multi-month corrective decline sequences in the S&P 500; for example, from 27 Jul 2023 to 27 October 2023.
Hence, the risk of another spike in the VIX cannot be ruled out.
Short-term bullish momentum has waned in the Nasdaq 100
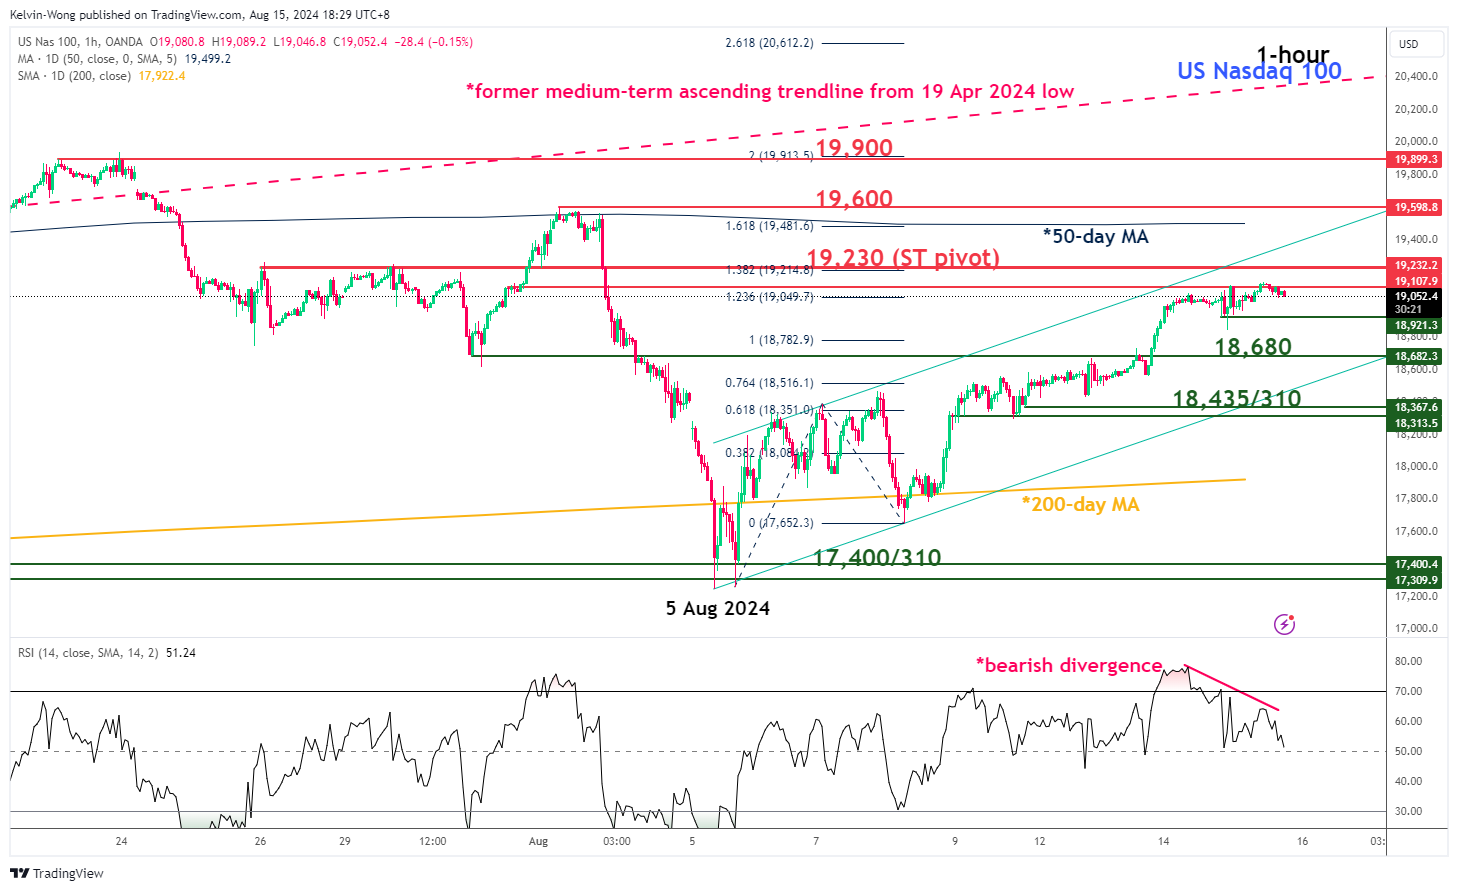
Fig 3: Nasdaq 100 CFD short-term trend as of 15 Aug 2024 (Source: Trading View, click to enlarge chart)
In the lens of technical analysis, the short-term bullish momentum of the minor uptrend phase for the Nasdaq 100 CFD (a proxy of Nasdaq 100 E-mini futures) has started to show signs of exhaustion via the recent bearish divergence condition flashed out by the hourly RSI momentum indicator at its overbought region.
If the 19,230 short-term pivotal resistance is not surpassed to the upside, the Nasdaq 100 CFD faces the risk of a near-term corrective decline to expose the intermediate supports of 18,680 and 18,435/310.
On the flip side, a clearance above 19,230 invalidates the bearish scenario for the continuation of the uptrend phase for the next intermediate resistances to come in at 19,600 and 19,900.
Content is for general information purposes only. It is not investment advice or a solution to buy or sell securities. Opinions are the authors; not necessarily that of OANDA Business Information & Services, Inc. or any of its affiliates, subsidiaries, officers or directors. If you would like to reproduce or redistribute any of the content found on MarketPulse, an award winning forex, commodities and global indices analysis and news site service produced by OANDA Business Information & Services, Inc., please access the RSS feed or contact us at info@marketpulse.com. Visit https://www.marketpulse.com/ to find out more about the beat of the global markets. © 2023 OANDA Business Information & Services Inc.

Kelvin Wong
Passionate about connecting the dots in the financial markets and sharing perspectives around trading and investment, Kelvin Wong is an expert in using a unique combination of fundamental and technical analyses, specializing in Elliott Wave and fund flow positioning, to pinpoint key reversal levels in the financial markets.
In addition, over the last ten years, Kelvin has conducted numerous market outlook and trading-related seminars, as well as technical analysis training courses, for thousands of retail traders.
Latest posts by Kelvin Wong (see all)
- Nasdaq 100 Technical: At risk of staging a multi-week corrective decline - 20 December 2024
- Gold Technical: A less dovish Fed may reinforce a medium-term corrective decline - 16 December 2024
- AUD/USD: Surviving at the 0.6360 key support (for now) but the long-term trend remains bearish - 13 December 2024