- Short to medium-term market breadth conditions have improved which may offset the potential overconcentration risk inherent in Nvidia.
- The earlier lagged quality factor has now joined the positive momentum factor to support the ongoing medium-term bullish trends of the S&P 500, and Nasdaq 100.
- Watch the key medium-term support of 19,240 on the Nasdaq 100.
This is a follow-up analysis of our prior report, “Nasdaq 100: Minor melt-up sequence may have hit a roadblock” published on 13 June 2024. Click here for a recap.
Since our last publication, the price actions of the Nasdaq 100 CFD have only staged a minor shallow dip to 19,478 on 14 June before it cleared above the 19,800 key short-term resistance on Monday, 17 June.
Thereafter, it continued to rally and printed a fresh all-time high of 19,990 on Monday which has been led by one of its top market-capitalized component stocks, Nvidia on the backdrop of artificial intelligence (AI) optimism theme play.
So far, the share price of Nvidia has continued to rally on Tuesday, 18 June, and dethroned Microsoft as the number one market cap weighted stock in the Nasdaq 100 with a total market capitalization value of US$3.335 trillion.
The current amazing year-to-date rally Nivida as of 18 June stands at a whopping 185% return that surpassed the return of Nasdaq 100 (22%) and S&P 500 (17%) by a significant margin over the same period. Hence, the drumming of an overconcentration risk has increased which in turn may trigger a significant correction in the Nasdaq 100 in the current high dispersion and average implied low correlation environment among the top component stocks within the Nasdaq 100 and S&P 500.
On the positive side of the narrative, two positive factors still support the ongoing medium-term bullish trends of both the Nasdaq 100 and S&P 500.
Short to medium-term market breadth has improved
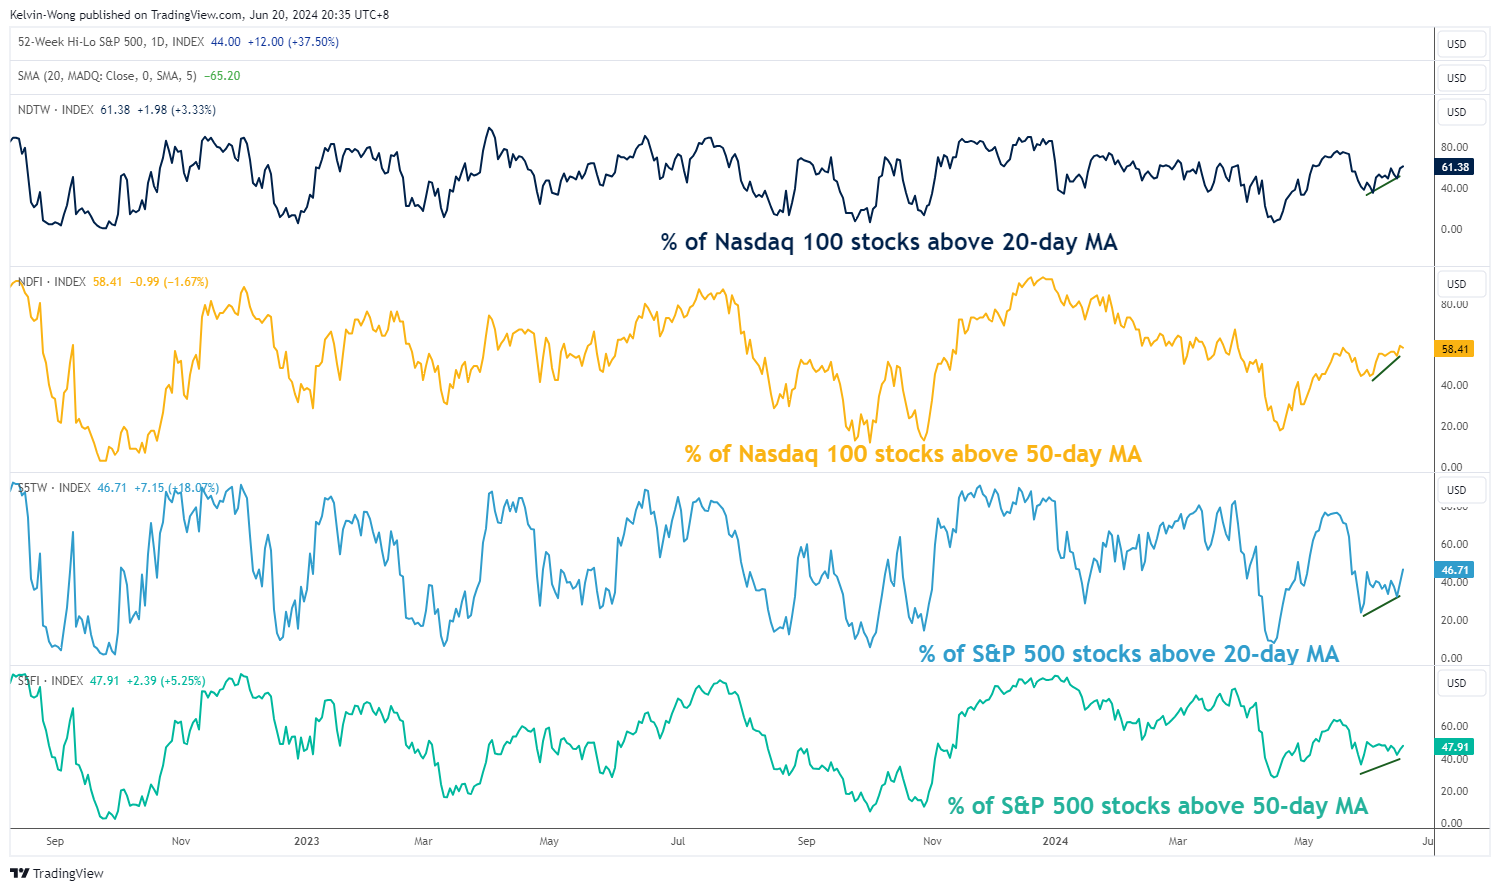
Fig 1: Market breadth indicators of Nasdaq 100 and S&P 500 as of 18 Jun 2024 (Source: Trading View, click to enlarge chart)
The market breadth of the Nasdaq 1000 has continued to display positive conditions that support its ongoing bullish trend. The number of component stocks trading above their respective 20-day and 50-day moving averages has increased steadily in the past three weeks since the end of May.
The percent of Nasdaq 100 component stocks above their respective 20-day moving averages has risen to 61% as of Tuesday, 18 June, and an increase to 58% for the portion of Nasdaq 00 component stocks trading above the 50-day moving average (see Fig 1).
On a side note, similar positive market breadth observations have also been seen on the S&P 500 albeit at a slower pace; 47% of S&P 500 component stocks above the 20-day moving average (an improvement from 24% on 29 May, and 48% of S&P 500 component stocks above 50-day moving average (an improvement from 36% on 29 May).
The lagging quality factor has now moved in line with leading momentum factor
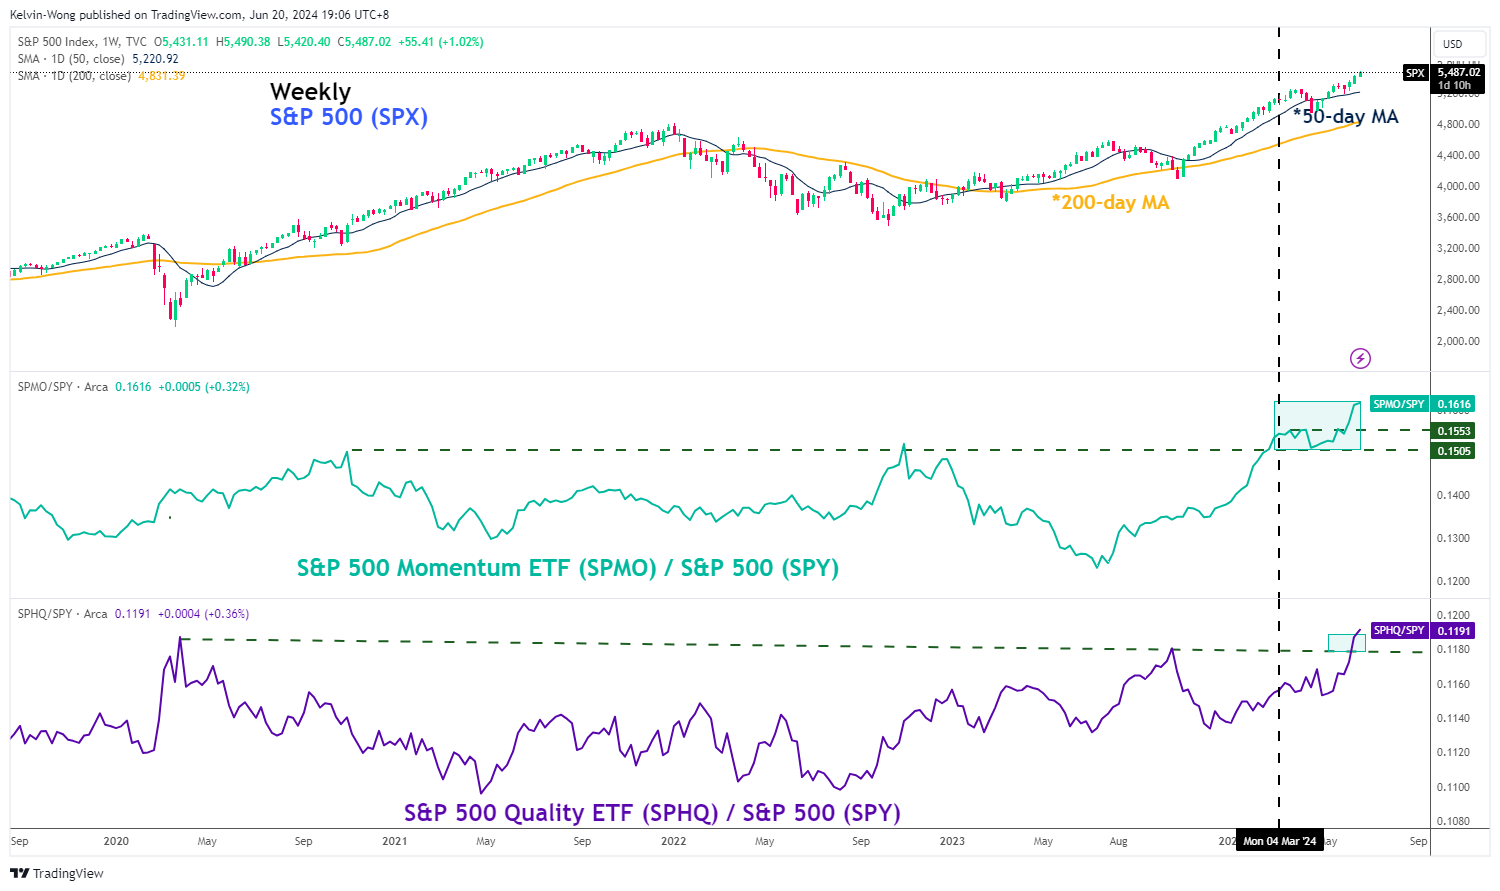
Fig 2: Relative strength of S&P 500 Momentum & Quality factors ETFs as of 18 Jun 2024 (Source: Trading View, click to enlarge chart)
Since early March 2024, the momentum factor has been the leading element that is doing the “bulk of the lifting” to support the bullish trend seen in the US stock market, using the S&P 500 as the barometer gauge.
The “rejigged” S&P 500 Momentum exchange-traded fund (ETF) is a reweighting of the S&P 500 component stocks according to a momentum factor, and stocks that have a higher momentum score will be ranked higher inside the ETF. The ratio of the S&P 500 Momentum ETF against the S&P 500 which is a measurement of relative strength has staged a major bullish breakout and hit a fresh all-time in early March and thereafter, the ratio has continued to print a series of fresh all-time highs which suggests the positive momentum factor is leading the fort.
On the other hand, the quality factor has lagged, measured by the ratio of the S&P 500 Quality ETF against the S&P 500 from March 2020 to late May 2024. Interestingly, the ratio has staged a bullish breakout in the week of 10 June.
The recent positive follow-through seen in the lagging quality factor has indicated a more balanced nuance in the US stock market which supports the ongoing bullish trend in the Nasdaq 100 as well as the S&P 500.
Bullish acceleration in Nasdaq 100
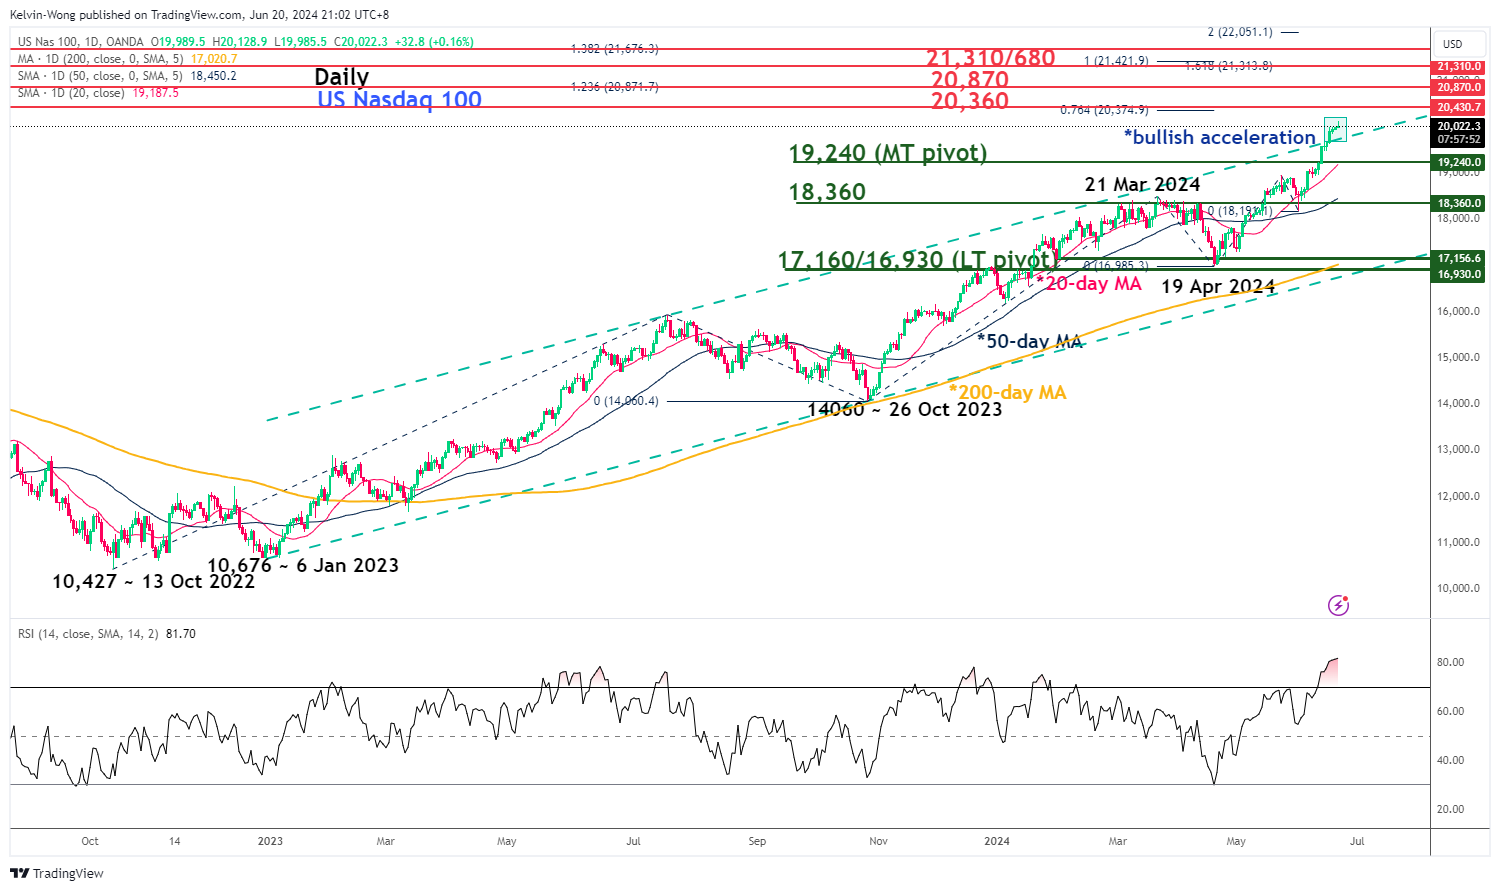
Fig 3: Nasdaq 100 CFD medium-term trend as of 20 Jun 2024 (Source: Trading View, click to enlarge chart)
The recent upmove seen in the Nasdaq 100 CFD on 17 June has broken out above the upper boundary of the major ascending channel in place since early January 2023 which suggests a bullish acceleration condition.
If the 19,240 key medium-term pivotal support holds (that also confluences with the 20-day moving average), the medium-term uptrend remains intact with the next intermediate resistances coming in at 20,360 and 20,870 from a multi-week perspective.
However, a breakdown below 19,249 negates the bullish tone for a potential deeper corrective decline within its major uptrend phase to expose the next support at 18,360 (also the 50-day moving average).
Content is for general information purposes only. It is not investment advice or a solution to buy or sell securities. Opinions are the authors; not necessarily that of OANDA Business Information & Services, Inc. or any of its affiliates, subsidiaries, officers or directors. If you would like to reproduce or redistribute any of the content found on MarketPulse, an award winning forex, commodities and global indices analysis and news site service produced by OANDA Business Information & Services, Inc., please access the RSS feed or contact us at info@marketpulse.com. Visit https://www.marketpulse.com/ to find out more about the beat of the global markets. © 2023 OANDA Business Information & Services Inc.

Kelvin Wong
Passionate about connecting the dots in the financial markets and sharing perspectives around trading and investment, Kelvin Wong is an expert in using a unique combination of fundamental and technical analyses, specializing in Elliott Wave and fund flow positioning, to pinpoint key reversal levels in the financial markets.
In addition, over the last ten years, Kelvin has conducted numerous market outlook and trading-related seminars, as well as technical analysis training courses, for thousands of retail traders.
Latest posts by Kelvin Wong (see all)
- Nasdaq 100 Technical: At risk of staging a multi-week corrective decline - 20 December 2024
- Gold Technical: A less dovish Fed may reinforce a medium-term corrective decline - 16 December 2024
- AUD/USD: Surviving at the 0.6360 key support (for now) but the long-term trend remains bearish - 13 December 2024