- The price actions of Nasdaq 100 have reached the lower limit of a major resistance zone at 18,435/620.
- Heightened over-concentration risk from Nvidia as its current year-to-date returns of 87% contributed to 55% of Nasdaq 100’s year-to-date return of 10.50% as of 27 March.
- Nasdaq 100’s market breadth indicators have started to deteriorate which increases the risk of an imminent multi-week corrective decline sequence.
This is a follow-up analysis of our prior report, “Nasdaq 100 Technical: Bulls rescued by Nvidia (again)” published on 23 February 2024. Click here for a recap.
Since the publication of our previous analysis, the price actions of the US Nas 100 Index (a proxy of the Nasdaq 100 future) have continued to surge upwards towards 18,270 and 18,435 resistance levels as flagged in our report. Thereafter, the red-hot Index rocketed to print another fresh all-time high of 18,497 on last Thursday, 21 March ex-post FOMC.
The current major uptrend phases of the major US benchmark stock indices; S&P 500, Nasdaq 100, and Dow Jones Industrial Average in place since their respective October 2023 lows have continued to oscillate in impulsive bullish up moves sequences without any medium-term multi-week correction corrective decline of -5% or more, except for the small-caps Rusell 2000 that saw a loss of -8.4% during the period of 26 December 2023 to 16 January 2024 (high to low).
Over-concentration risk from Artificial Intelligence (AI) theme play
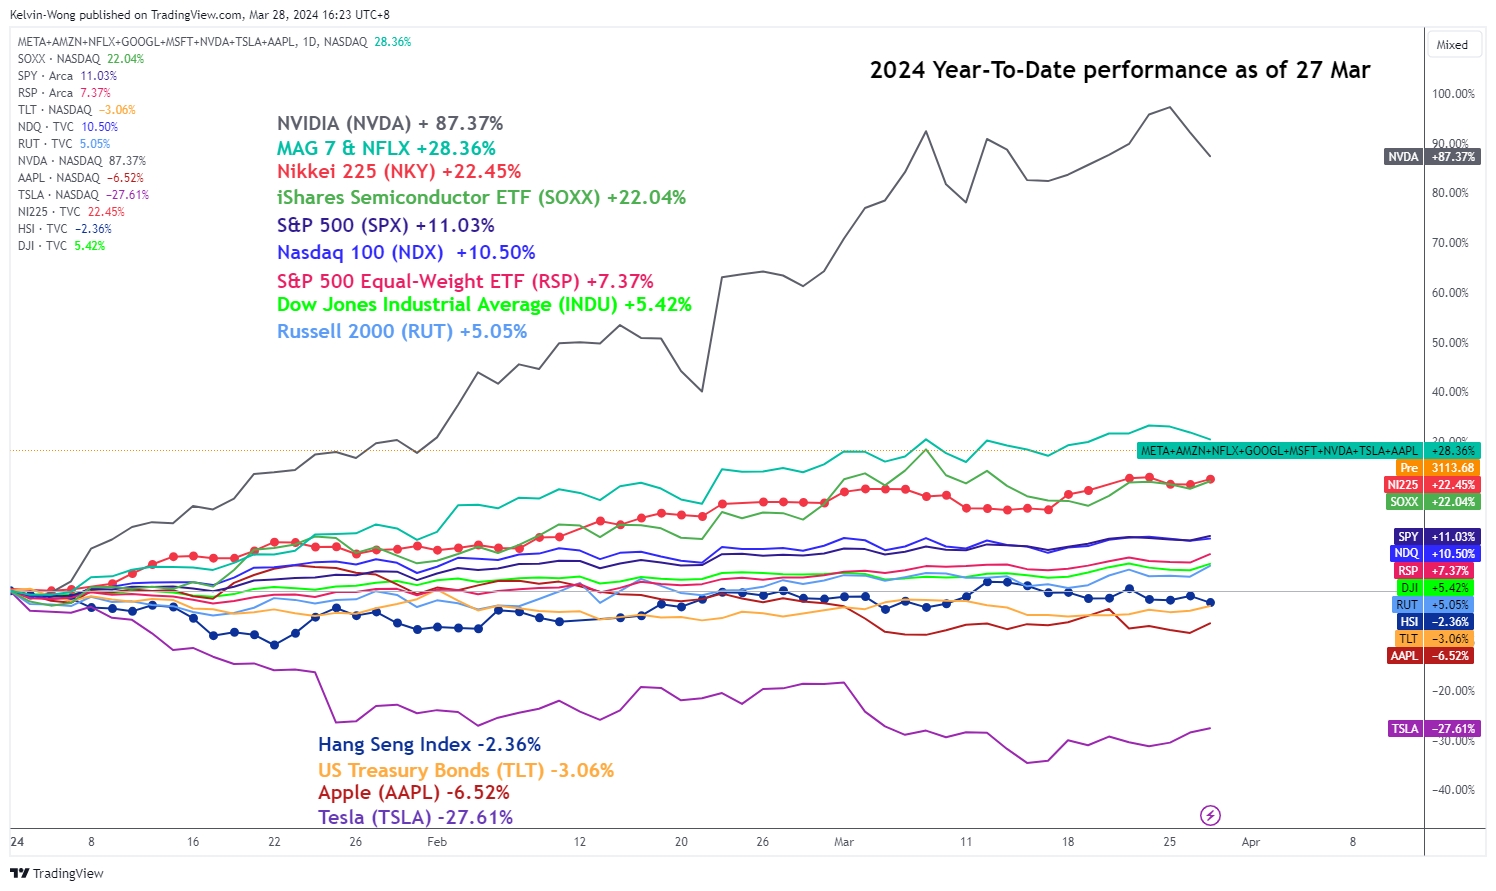
Fig 1: 2024 YTD performance of major US benchmark stock indices & key component stocks & ETFs as of 27 Mar 2024 (Source: TradingView, click to enlarge chart)
Q1 2024 is ending soon with one more day to go, the year-to-date performances of the major US benchmark stock indices as of yesterday, 27 March look set to end positively with another second consecutive winning quarter led by the S&P 500 (+11.03%), and Nasdaq 100 (+10.50%) with the Dow Jones Industrial Average (5.42%) as well as Russell 2000 (+5.05%) trailing behind.
The main significant star contributor has been the stellar bullish run of Nvidia that rocketed to a year-to-date return of +87.37% (with a current peak of +97.24%) due to its market leadership in producing bespoke semiconductor chips that are being used to power up the current in-demand hardware servers to run generative AI functions for corporations (see Fig 1).
At this current rate of return seen in the share price of Nvidia has surpassed the returns of the S&P 500 and Nasdaq 100 by around a multiple of 9 X, also due to the market capitalization weightage calculation of the component stocks that make up the S&P 500, and Nasdaq 100, Nvidia has risen to become the third-ranked component stock behind Apple, Microsoft with a weightage of 5.30%, and 6.60% respectively.
In a nutshell, after a simple calculation using the current S&P 500, and Nasdaq 100 market cap weightage coupled with the current year-to-date return of +87.37% of Nvidia, the sole share price movement of Nvidia has contributed almost half the current-year-date return of S&P 500 at 42%, and a larger extend of 55% for Nasdaq 100.
A lone star that is holding the fort without any significant bullish support from the rest has increased the risk of vulnerability to trigger a potential multi-week correction in the US benchmark stock indices if macro factors deteriorate such as a reduction in the Fed dovish pivot narrative in terms of the number of interest rate cuts for 2024 (currently three cuts are being priced in according to CME FedWatch Tool), a further uptick in the geopolitical risk premium, and the rise of a currency war if the China central bank, PBoC attempts to guide the Chinese yuan to weaker levels against the US dollar.
Market breadth has turned lacklustre
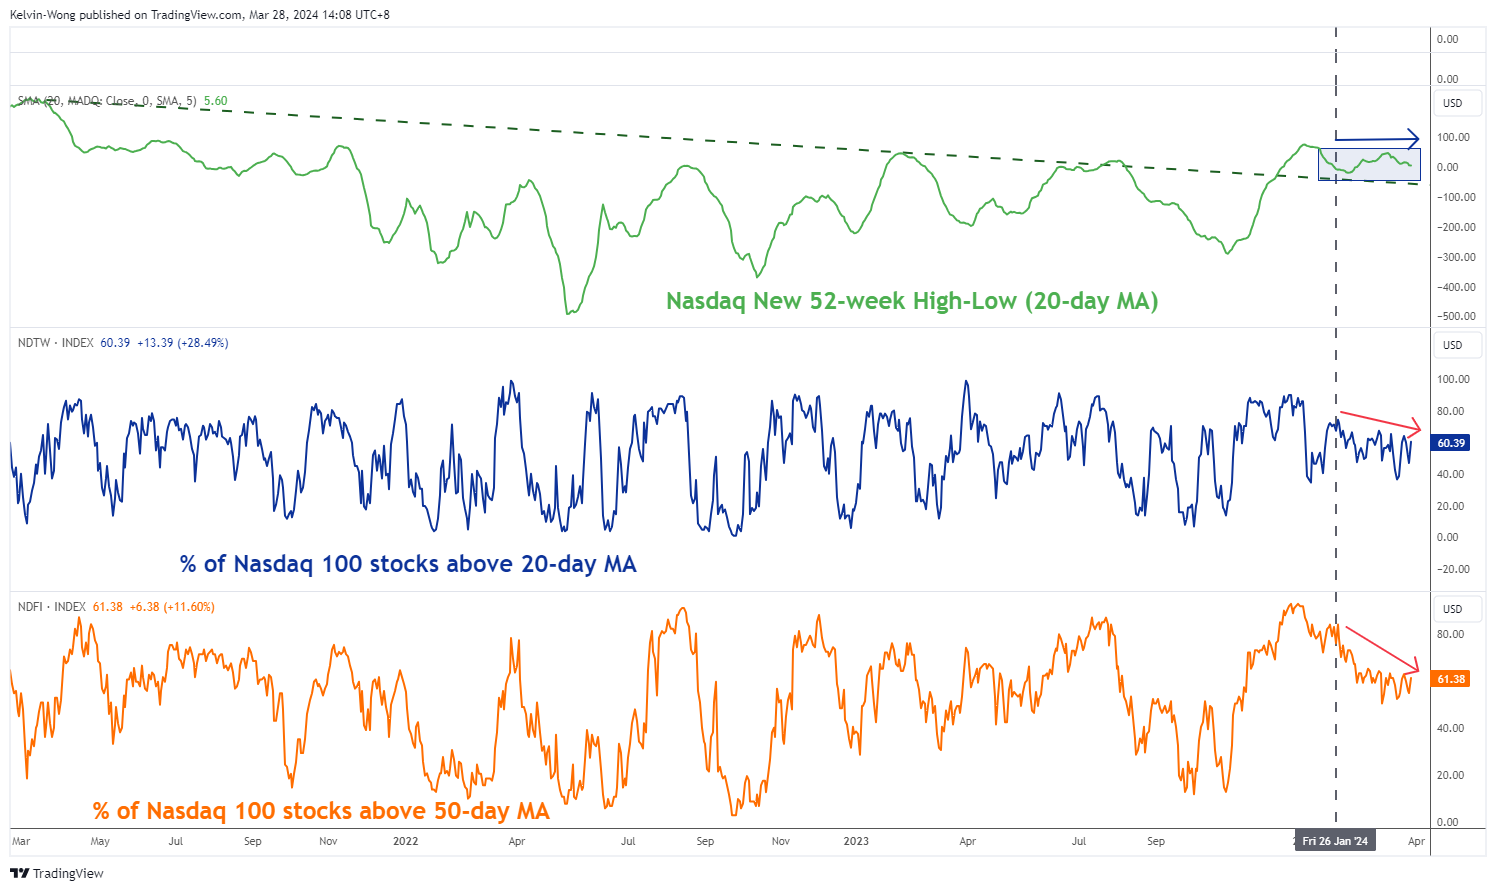
Fig 2: Market breadth indicators of Nasdaq Composite & Nasdaq 100 as of 27 Mar 2024 (Source: TradingView, click to enlarge chart)
On top of the over-concentration risk from Nvidia highlighted earlier, the market breadth of Nasdaq 100 has also deteriorated in the past month.
The new 52-week High/Low (20-day moving average) of the larger Nasdaq Composite has started to turn flat since 26 January 2024 which suggests that fewer component stocks within the Nasdaq Composite are making new 52-week highs as compared to new 52-week lows.
To add salt to this bearish technical element, the percentage of component stocks inside the Nasdaq 100 that are holding above their respective 20-day and 50-day moving averages has fallen over the same period with the most significant observation seen on the 50-day moving averages where the percentage of component stocks have fallen to 61% as of yesterday, 28 March from 76% printed previously on 26 January 2024.
A glaring bearish divergence condition remains intact on the Nasdaq 100
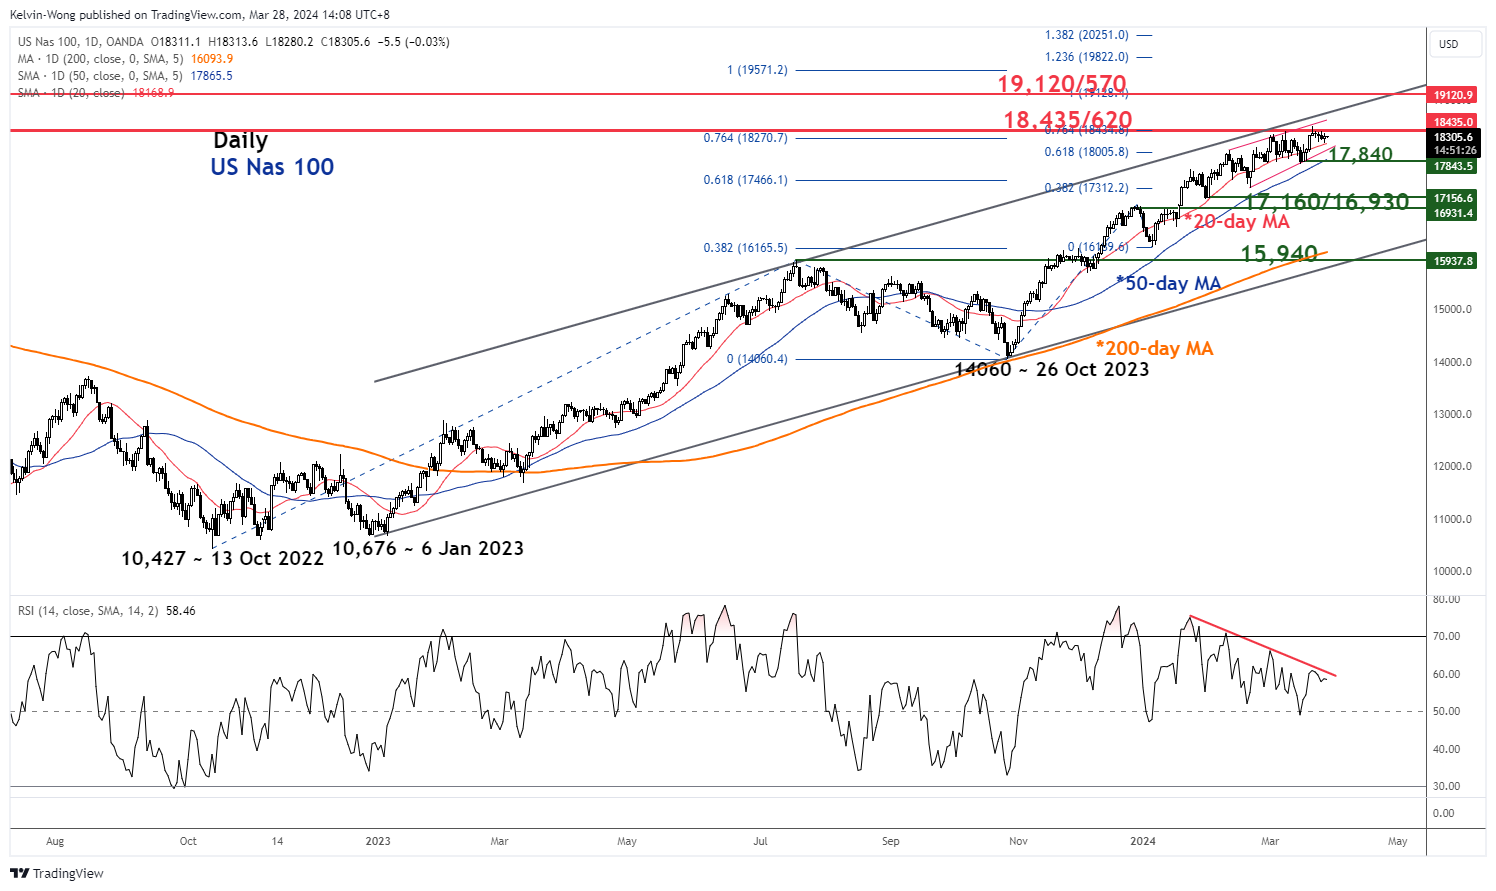
Fig 3: US Nas 100 medium-term & major trends as of 28 Mar 2024 (Source: TradingView, click to enlarge chart)
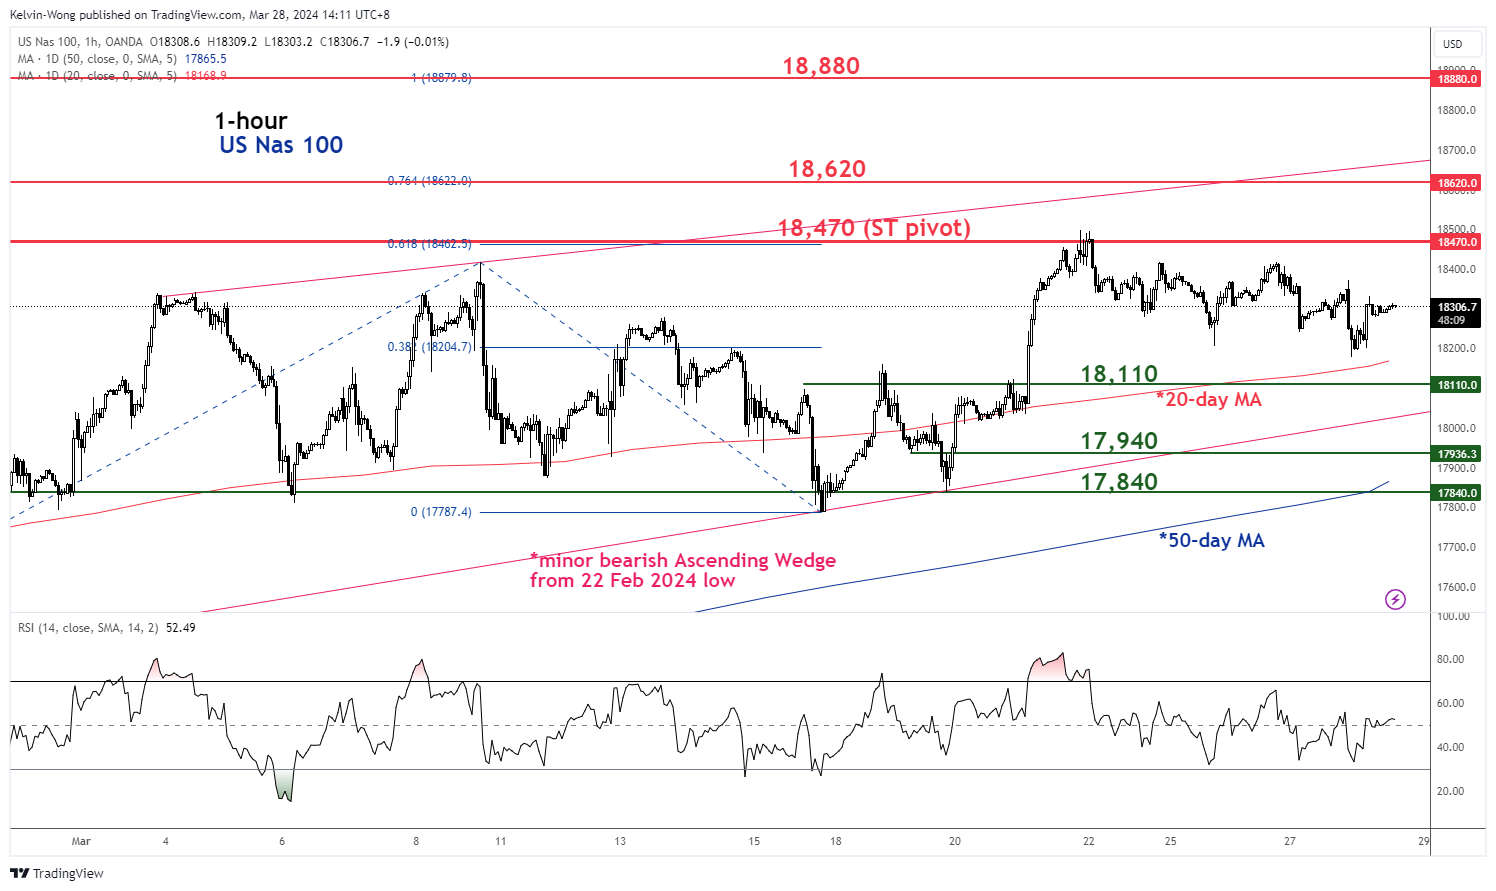
Fig 4: US Nas 100 short-term trend as of 28 Mar 2024 (Source: TradingView, click to enlarge chart)
In the lens of technical analysis, the major bullish trend of the US Nas 100 Index (a proxy of the Nasdaq 100 future) in place since the 26 October 2023 low of 14,060 is flashing out bearish conditions that increase the odds of at least an imminent multi-week corrective decline that may unfold next after a strong impulsive up move.
In the past week, its price actions have pushed up and hit the major resistance zone of 18,435/620 (also the upper boundary of a long-term secular ascending channel from the 6 January 2023 low). In conjunction, it has also formed a bearish “Ascending Wedge” configuration since 22 February 2024 coupled with a persistent bearish divergence seen in the daily RSI momentum indicator, a sign that medium-term upside momentum is waning (see Fig 3). A clear break with a daily close below the 17,840 support may trigger the start of the potential multi-week corrective decline with the next medium-term support zone to watch at 17,160/16,930.
On the shorter-term time horizon, as seen on the hourly chart, its price actions have turned choppy since 4 March 2023 as it has been “sandwiched” between 18,470 and 18,110 (close to the 20-day moving average) (see Fig 4).
In the interim, the key short-term pivotal resistance stands at 18,470 with key near-term support at 18,110. A break below 18,110 may expose the next intermediate supports of 17,940 and 17,840.
On the flip side, a clearance above 18,470 invalidates the bearish tone for a squeeze up toward the upper limit of the major resistance at 18,620.
Content is for general information purposes only. It is not investment advice or a solution to buy or sell securities. Opinions are the authors; not necessarily that of OANDA Business Information & Services, Inc. or any of its affiliates, subsidiaries, officers or directors. If you would like to reproduce or redistribute any of the content found on MarketPulse, an award winning forex, commodities and global indices analysis and news site service produced by OANDA Business Information & Services, Inc., please access the RSS feed or contact us at info@marketpulse.com. Visit https://www.marketpulse.com/ to find out more about the beat of the global markets. © 2023 OANDA Business Information & Services Inc.

Kelvin Wong
Passionate about connecting the dots in the financial markets and sharing perspectives around trading and investment, Kelvin Wong is an expert in using a unique combination of fundamental and technical analyses, specializing in Elliott Wave and fund flow positioning, to pinpoint key reversal levels in the financial markets.
In addition, over the last ten years, Kelvin has conducted numerous market outlook and trading-related seminars, as well as technical analysis training courses, for thousands of retail traders.
Latest posts by Kelvin Wong (see all)
- Nasdaq 100 Technical: At risk of staging a multi-week corrective decline - 20 December 2024
- Gold Technical: A less dovish Fed may reinforce a medium-term corrective decline - 16 December 2024
- AUD/USD: Surviving at the 0.6360 key support (for now) but the long-term trend remains bearish - 13 December 2024