- Fresh highs printed yesterday but weak retail sales appear to weigh on the Nasdaq 100 and S&P 500.
- S&P 500 on a run of 330 days since recording a loss of 2% making it the longest streak since February 2018.
- Nasdaq eyeing a key trendline break.
Fundamental Overview
US Indices continued their advance yesterday with the Nasdaq 100 hitting another all-time high.The Nasdaq 100 came within a whisker of the 20000 mark before losing some momentum ahead of the market open today. This was closely followed by the S&P 500 which hit a fresh high as well as the magnificent 7 continue to lead the way.
Investor sentiment seems to be largely positive at this stage with market participants having to adjust forecasts in what some are calling “one of the most resilient markets in history. Citigroup yesterday announced that it had raised its outlook for US equities to overweight from neutral. Goldman Sachs on the other hand upgraded their year end target for the S&P 500 to 5600, around 3% from the current price of 5481 (at the time of writing).
It seems that regardless of what the Federal Reserve does or says right now, U.S. indices continue to perform well. U.S. retail sales data were worse than expected, causing the Nasdaq 100 and S&P 500 to take a slight pause following the fresh highs printed yesterday. Despite this, I don’t expect a significant pullback right now. It’s been 330 days since the S&P 500 saw a decline of 2% or more, making this the longest streak since February 2018. The Juneteenth holiday in the US tomorrow also means that we could see low liquidity toward the end of the US session today which could undoubtedly continue tomorrow.
Nasdaq 100 Heatmap, June 18, 2024
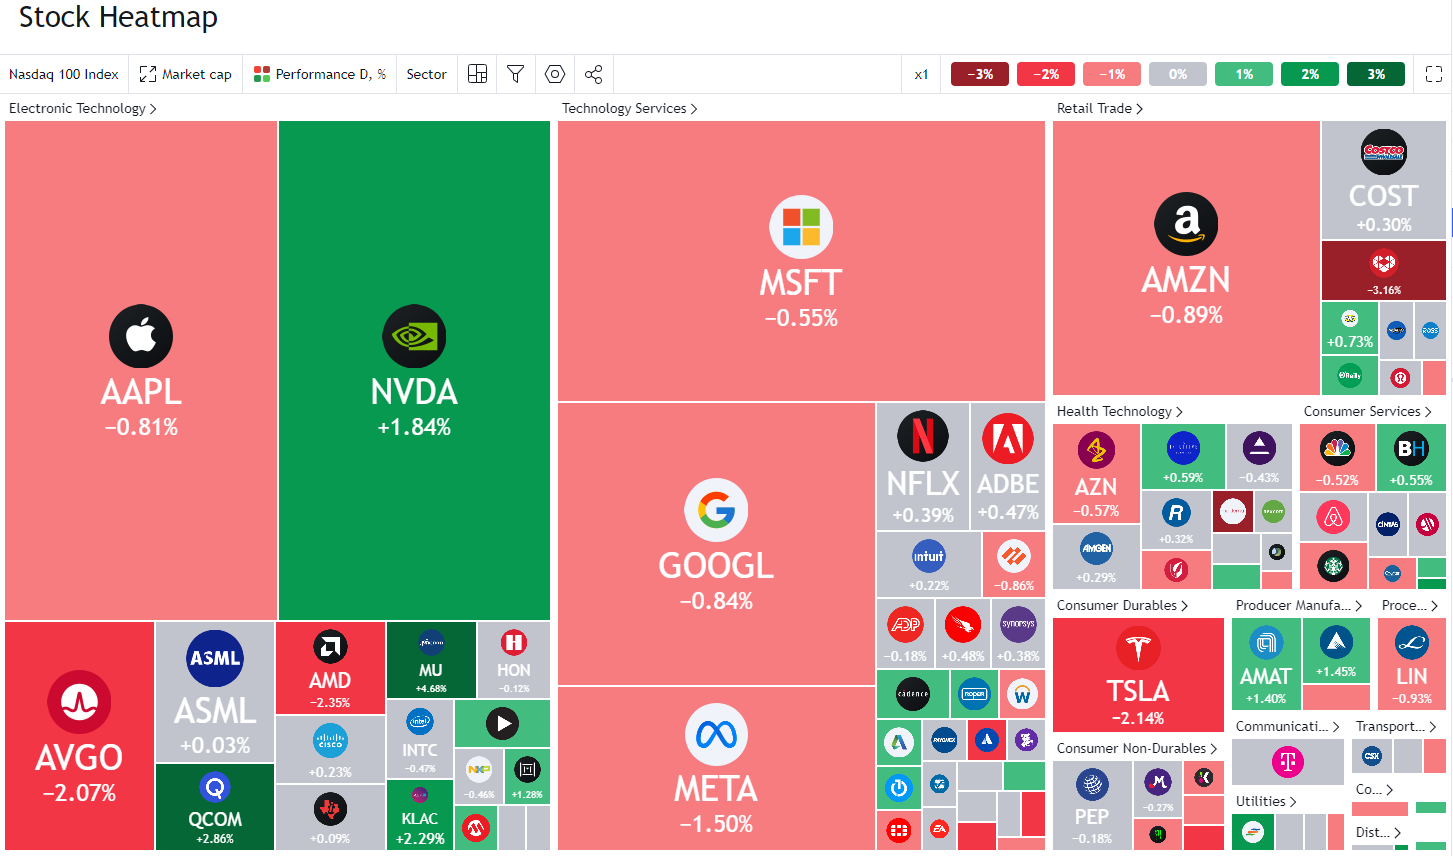
Source: TradingView.Com (click to enlarge)
US data has failed to stall the rally in US indices for the majority of the year with bad news even managing to at times, deliver gains for the index. The retail sales data released earlier in the day did not paint a pretty sight and may be seen as an indication of the crunch facing consumers. This was made evident by consumer sentiment data following revisions which brings us to the all important question…. How long before this will start affecting company earnings?
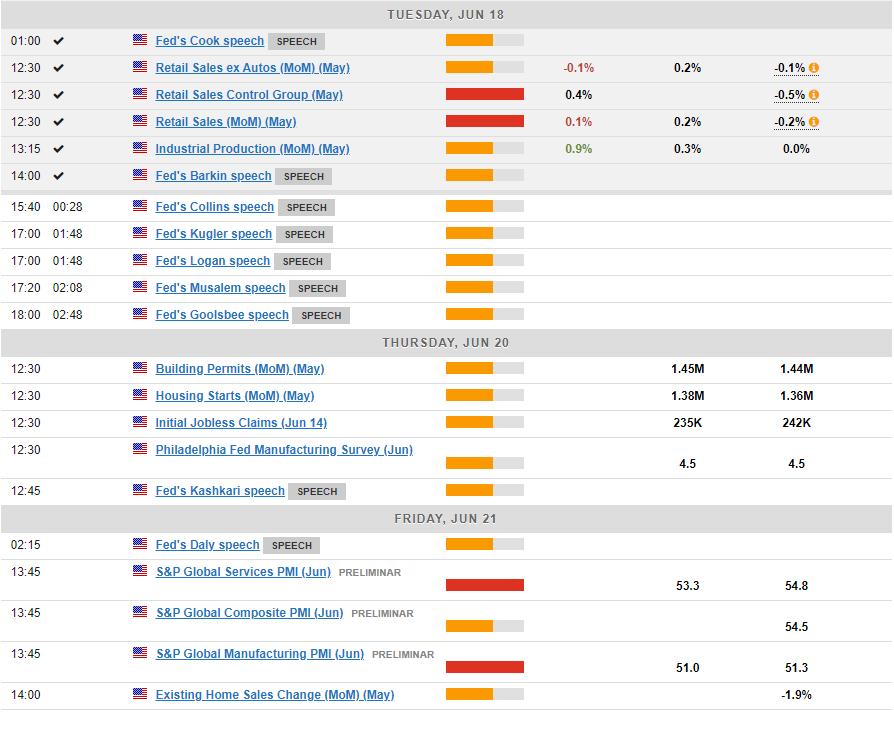
The Look Ahead: Fed Policymakers, Bank Holiday and US PMIs
As we look ahead to the rest of the day, several Federal Reserve policymakers are scheduled to speak, with more expected throughout the week. Hawkish remarks from these officials may be met with indifference, as this has been the Fed’s rhetoric for some time.
Any meaningful move or change to the outlook that tilts bearish from policymakers will definitely have a larger impact.
 For all market-moving economic releases and events, see the MarketPulse Economic Calendar.
Nasdaq 100, S&P 500 Technical Outlook
Looking at the S&P 500 and there is little to see in terms of historic price action. This makes analysis at these levels somewhat of a challenge. The H4 chart below shows the ascending channel from the May 31 low around 5190, the start of the most recent bullish rally. This puts the 5500 psychological level in the crosshairs. Whether or not the current rally to the upside will have the legs to push beyond the 5500 mark remains to be seen.
A daily candle close below the 5421 support area is needed for a trend change to take place. As long as this price level holds for now, the bullish sentiment is likely to remain.
S&P 500 Four-Hour (H4) Chart – June 18, 2024
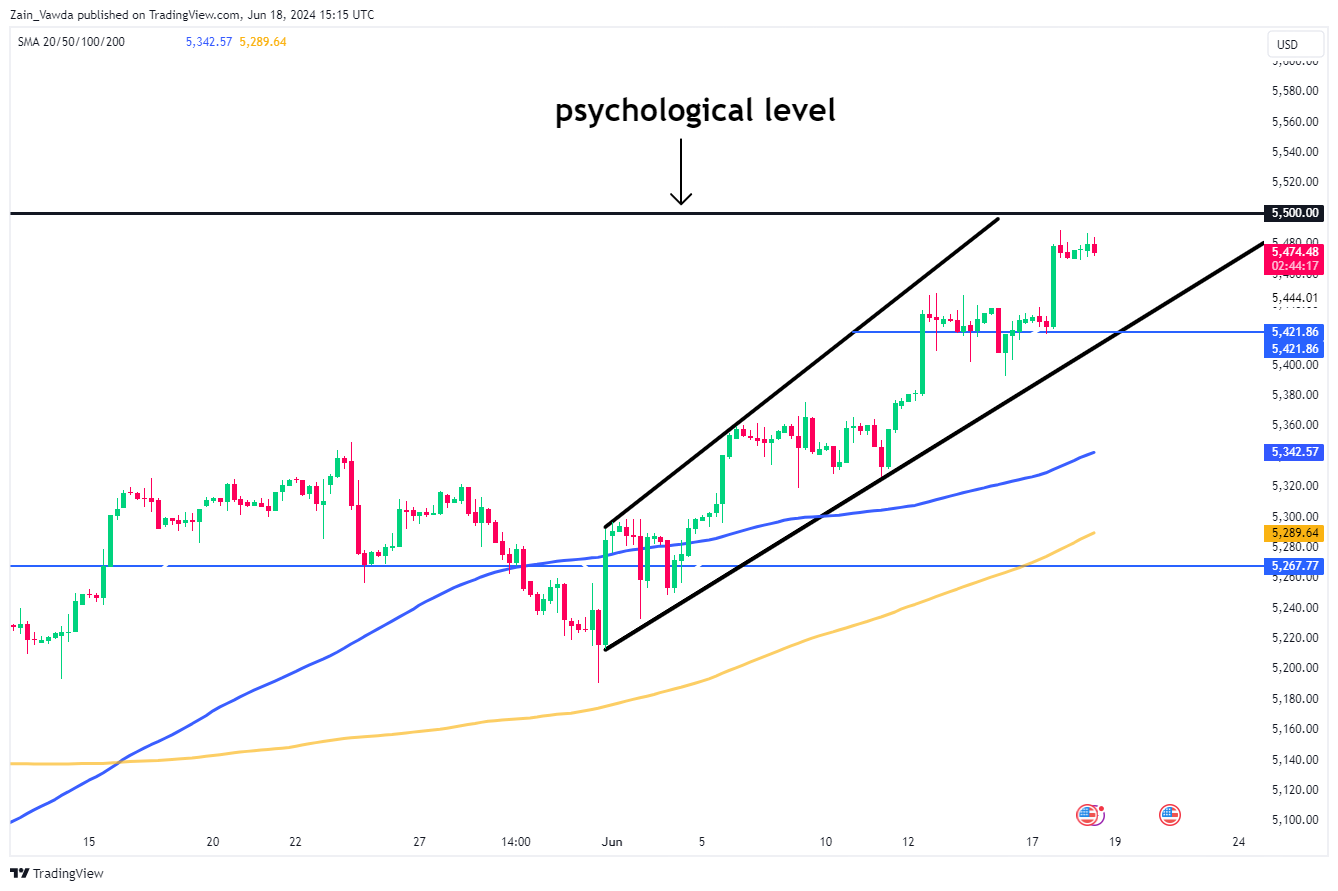
Source: TradingView.Com (click to enlarge)
The Nasdaq looks eerily similar to the S&P 500, hence why I am breaking down a more intraday look ahead on the H1 chart. The H1 chart shows an ascending trendline with a break below opening up a retest of the 100-day MA resting around the 19660 mark with another support area around 19362, represented by the 200-day MA. Also, important to note that on the H1 above we also have the double top pattern which could be a sign that the downtrend may soon gain momentum.
Nasdaq 100 One-Hour (H4) Chart – June 18, 2024
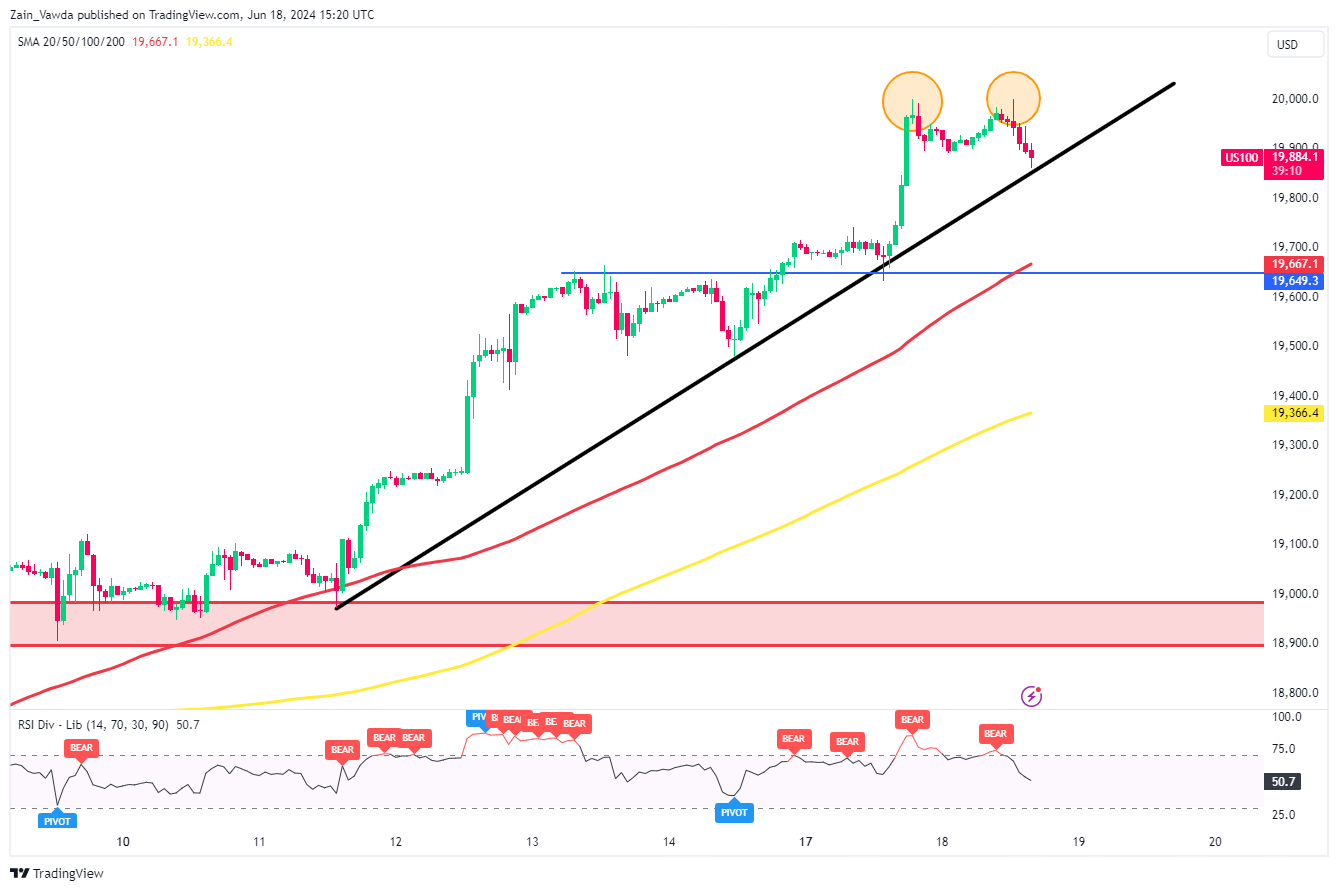
Source: TradingView.Com (click to enlarge)
Levels to Consider for the Nasdaq 100:
Support:
- 19855
- 19660
- 19360
Resistance:
- 19942
- 20000 (psychological level)
–
Content is for general information purposes only. It is not investment advice or a solution to buy or sell securities. Opinions are the authors; not necessarily that of OANDA Business Information & Services, Inc. or any of its affiliates, subsidiaries, officers or directors. If you would like to reproduce or redistribute any of the content found on MarketPulse, an award winning forex, commodities and global indices analysis and news site service produced by OANDA Business Information & Services, Inc., please access the RSS feed or contact us at info@marketpulse.com. Visit https://www.marketpulse.com/ to find out more about the beat of the global markets. © 2023 OANDA Business Information & Services Inc.

Zain Vawda
He has spent the last 3 years in an analyst role honing his skills across various financial domains, including technical analysis, economic data interpretation, price action strategies, and analyzing the geopolitical impacts on global markets. Currently, Zain is advancing in obtaining his Capital Markets & Security Analyst (CMSA) designation through the Corporate Finance Institute (CFI), where he has completed modules in fixed income fundamentals, portfolio management fundamentals, equity market fundamentals, introduction to capital markets, and derivative fundamentals.
He is also a regular guest on radio and television programs in South Africa, providing insight into global markets and the economy. Additionally, he has contributed to the development of a financial markets course approved by BankSeta (Banking Sector Education and Training Authority) at NQF level 6 in South Africa.
Latest posts by Zain Vawda (see all)
- Gold (XAU/USD) Technical Analysis: Bullish Structure Emerges - 23 December 2024
- Markets Weekly Outlook – S&P 500 in Focus as Markets Brace for Holiday Lull - 20 December 2024
- Stagflation Fears and Soaring US Yields: S&P 500’s Next Move - 19 December 2024