- Nikkei 225 broke above a 4-week range configuration
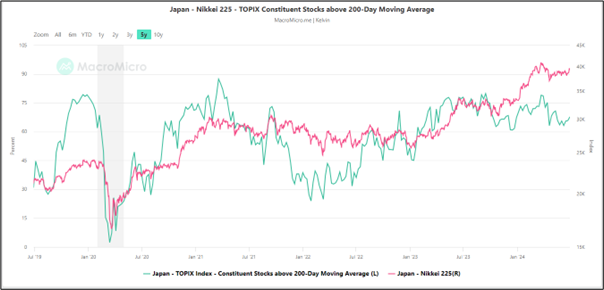
- Market breadth on the TOPIX has improved steadily as more of its component stocks have traded above their respective 200-day moving averages in the past three weeks.
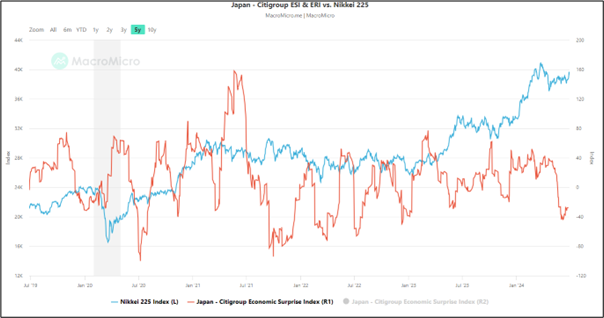
- Citigroup Economic Surprise Index for Japan has inched higher since the end of May which suggests an improvement in Japanese macro data.
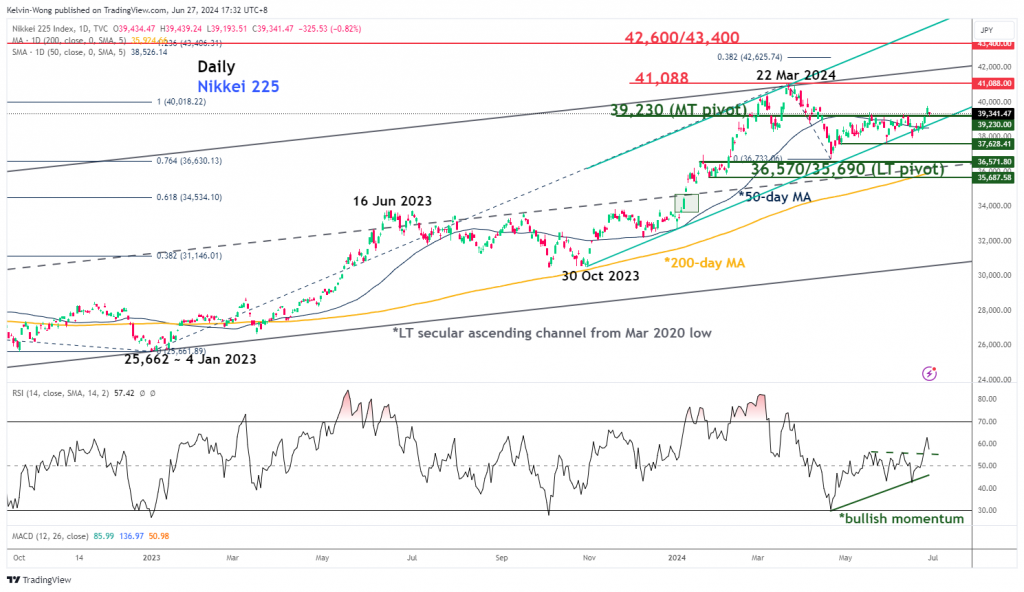
- Watch the 39,230 key medium-term support on Nikkei 225
This is a follow-up analysis of our prior report, “A steeper JGB yield curve may kickstart another bullish leg in the Nikkei 225” published on 14 May 2024. Click here for a recap.
Since our last publication, the price actions of the Nikkei 225 have traded sideways. However, they found support at the 50-day moving average and finally broke above its recent four-week range configuration from 15 April.
Also, this current bout of positive price actions comes in line with the continuation of the steepening of the Japanese Government Bond (JGB) yield curve where the yield spread between the 30-year and 2-year JGB has widened to an 11-year high to 1.94% at this time of the writing.
Right now, two key positive elements have emerged to support a further potential positive price action follow-through on the Nikkei 225 from a multi-week medium-term time horizon.
More Japanese stocks are trading above their 200-day moving averages
Fig 2: Percentage of TOPIX components stocks above 200-day MA as of 27 Jun 2024 (Source: MacroMicro, click to enlarge chart)
The market breadth of the Tokyo Stock Price Index (TOPIX) which has a wider coverage of Japanese component stocks over the Nikkei 225, with close to 2,000 constituents (a better gauge on the health of the Japanese stock market) has improved in the past three weeks (see Fig 1).
The percentage of component stocks in the TOPIX has increased to 68% as of today, 27 June from 63% on 7 June which suggests an increasing number of Japanese stocks are still evolving in their respective long-term bullish trends.
Improvement in Japanese macro data
Fig 2: Japan Citigroup Economic Surprise Index as of 24 Jun 2024 (Source: MacroMicro, click to enlarge chart)
Since the end of May, the Citigroup Economic Surprise Index for Japan has been on a path of rebound from -43.80 printed on 31 May to hit -27.60 on 24 June which suggests there are lesser economic data in Japan that missed consensus expectations, in turn, supports a medium-term bullish trend on the Nikkei 225 (see Fig 2).
Watch the 39,230 key medium-term support on Nikkei 225
Fig 3: Nikkei 225 major & medium-term trends as of 27 Jun 2024 (Source: TradingView, click to enlarge chart)
The daily RSI momentum indicator has flashed out a bullish momentum condition that supports a potential positive follow-through in price actions after the bullish breakout seen on the Nikkei 225 on Wednesday, 26 June.
If the 39,230 medium-term pivotal support holds, the Nikkei 225 may kickstart another potential impulsive upmove sequence to retest the current all-time high level of 41,088 and clearance above it sees the next medium-term resistance zone to come in at 42,600/43,400.
However, a break below 39,230 invalidates the bullish breakout scenario for another round of choppy corrective decline movements to expose the next medium-term support at 37,630 in the first step.
Content is for general information purposes only. It is not investment advice or a solution to buy or sell securities. Opinions are the authors; not necessarily that of OANDA Business Information & Services, Inc. or any of its affiliates, subsidiaries, officers or directors. If you would like to reproduce or redistribute any of the content found on MarketPulse, an award winning forex, commodities and global indices analysis and news site service produced by OANDA Business Information & Services, Inc., please access the RSS feed or contact us at info@marketpulse.com. Visit https://www.marketpulse.com/ to find out more about the beat of the global markets. © 2023 OANDA Business Information & Services Inc.


