- A bullish rotation in play towards US small-cap Russell 2000 aided by the US Treasury yield curve bull steepener & potential revival of “Trumponomics”.
- Potential outperformance of Russell 2000 over Nasdaq 100 in the medium term.
- Watch the 2,146/108 key medium-term support on the Russell 2000.
This is a follow-up analysis of our prior report, “US DJIA: UST yield curve un-inversion may help the laggard to catch up” dated 4 July 2024. Click here for a recap.
Since our last publication, the Dow Jones Industrial Average (DJIA) has managed to clear above its 40,030 intermediate range resistance and hit a fresh all-time closing high of 40,2011 on Monday, 15 July. It’s fourth all-high record closing high so far this year versus the S&P 500 that recorded its 38th record close for 2024 on Monday.
Hence, the laggard DJIA has started to play catch-up to cover its underperformance gap against the S&P 500 and Nasdaq 100 as the US Treasury yield curve starts to shape a bull steepener; the 2-year yield has fallen at a faster pace than the drop seen on the 10-year yield in the past two weeks.
The return of “Trumponomics” may have also stoked a bullish rotation into Russell 2000
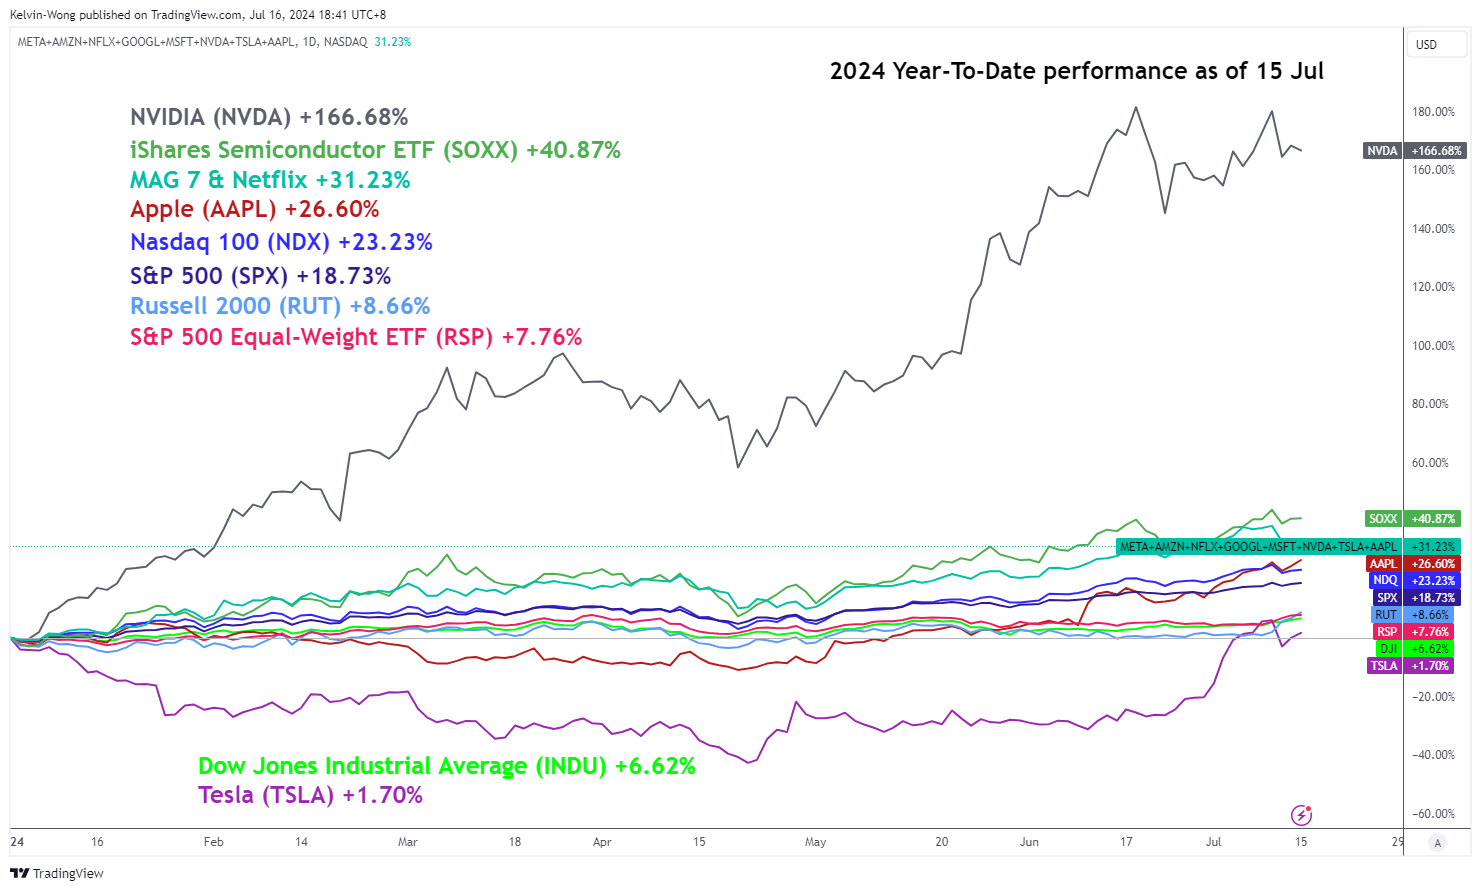
Fig 1: 2024 YTD performance of major US stock indices with mega-cap stocks as of 15 Jul 2024 (Source: TradingView, click to enlarge chart)
Another laggard among the major benchmark US stock indices is the small-caps Russell 2000 which has not yet made a fresh all-time intraday high or closing high since November 2021.
The Russell 2000’s current year-to-date performance as of Monday, 15 July stands at 8.66%, a further improvement from last Thursday, 11 July YTD performance of 5.58%. But it is still underperforming the S&P 500 (18.73%) and Nasdaq 100 (23.23%) which are heavily weighted towards the technology mega-cap stocks by a significant margin of around 10 to 15 percentage points (see Fig 1).
The Russell 2000 comprises of small-cap listed companies that derived most of their revenue streams (close to 80% on the aggregate) domestically in the US.
Hence, the Russell 2000 can be considered a bellwether for the US economy as it reflects the performance of smaller companies focusing on the US market. Given that the prospects of former US President Donald Trump winning the upcoming November Presidential Election have gained significant traction, the playbook of “Trumponomics” policies is likely to be at the forefront under the slogan of “Make America Great Again” where tax cuts and perhaps subsidies may be targeted towards small and medium domestically oriented firms in the US which in turn improve their profitability prospects that may further boost the bullish sentiment towards Russell 2000.
Bull steepening of the US Treasury yield curve negates the debt burden of Russell 2000
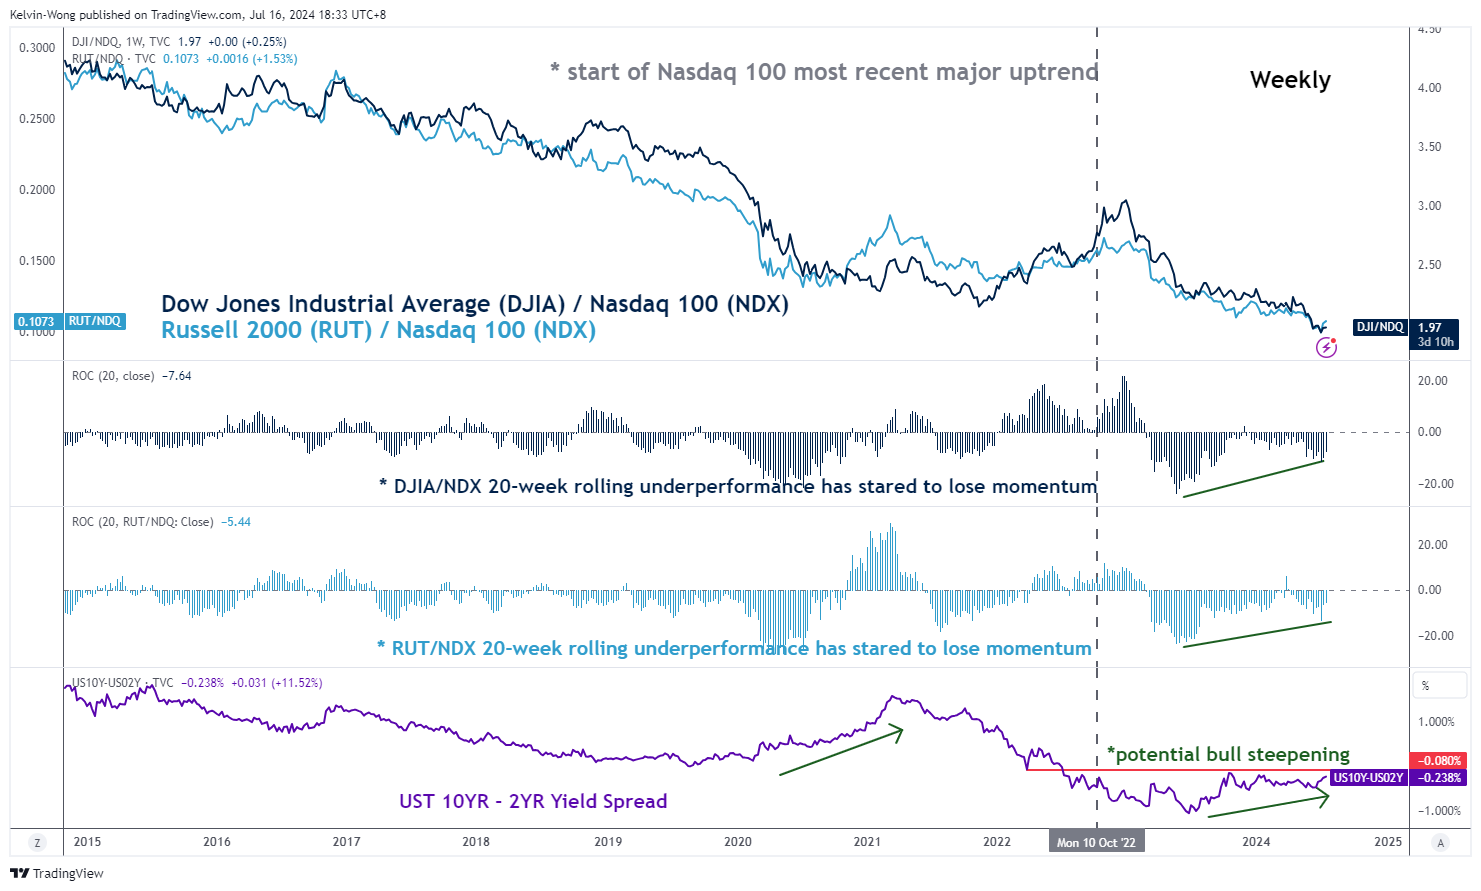
Fig 2: Ratio charts of Russell 200 & DJIA over Nasdaq 100 as of 15 Jul 2024 (Source: TradingView, click to enlarge chart)
The main fundamental reason for the persistent underperformance of the Russell 2000 against the larger-cap S&P 500 is that US small-cap firms have weaker pricing power, lower margins, and weaker balance sheets that weighed down on their earnings growth potential in an elevated high inflationary environment coupled with high interest rates.
In addition, close to 40 percent of the debt on Russell 2000 is on a short-term floating rate structure compared with about 9 percent for S&P 500 firms. Given that the latest US CPI data for June has started to show much clearer signs of core as well as services inflation is on a deceleration path which in turn led to a shift in the “higher interest rate for a longer period” rhetoric to a more dovish tilt by the public speeches made by Fed Chair Powell in the past two weeks.
Overall, the 2-year US Treasury yield has dropped by 36 basis points since the start of July till Monday, 15 July, much more than a 30 basis points drop in the longer tenure, 10-year US Treasury yield. Hence, a further magnitude of the decline in the 2-year US Treasury yield over its 10-year yield (bull steepening) is likely to lower the debt burden costs of Russell 2000 firms and improve their profitability trends.
Bullish conditions are sighted in the ratio chart of Russell 200/Nasdaq 100
The 20-week rate of change indicator of the ratio chart of the Russell 2000 over the Nasdaq 100 has flashed out a bullish divergence condition which suggests that the Russell 2000 persistent underperformance trend against the Nasdaq 100 since the start of Nasdaq 100 current major uptrend in October 2022 may start to reverse (see Fig 2).
Prior outperformance of the Russell 2000 over the Nasdaq 100 (expressed by the ratio chart) from November 2020 to March 2021 has been led by a steepening of the US Treasury yield curve (10-year minus 2-year) from April 2020 to March 2021.
Thus, a break above the -0.08% of the US 10-year/2-year Treasury yield spread may trigger a further potential bull steepening scenario, in turn, may see an outperformance in the Russell 2000 over the Nasdaq 100 as well as S&P 500.
Bullish breakout from a 2-year range
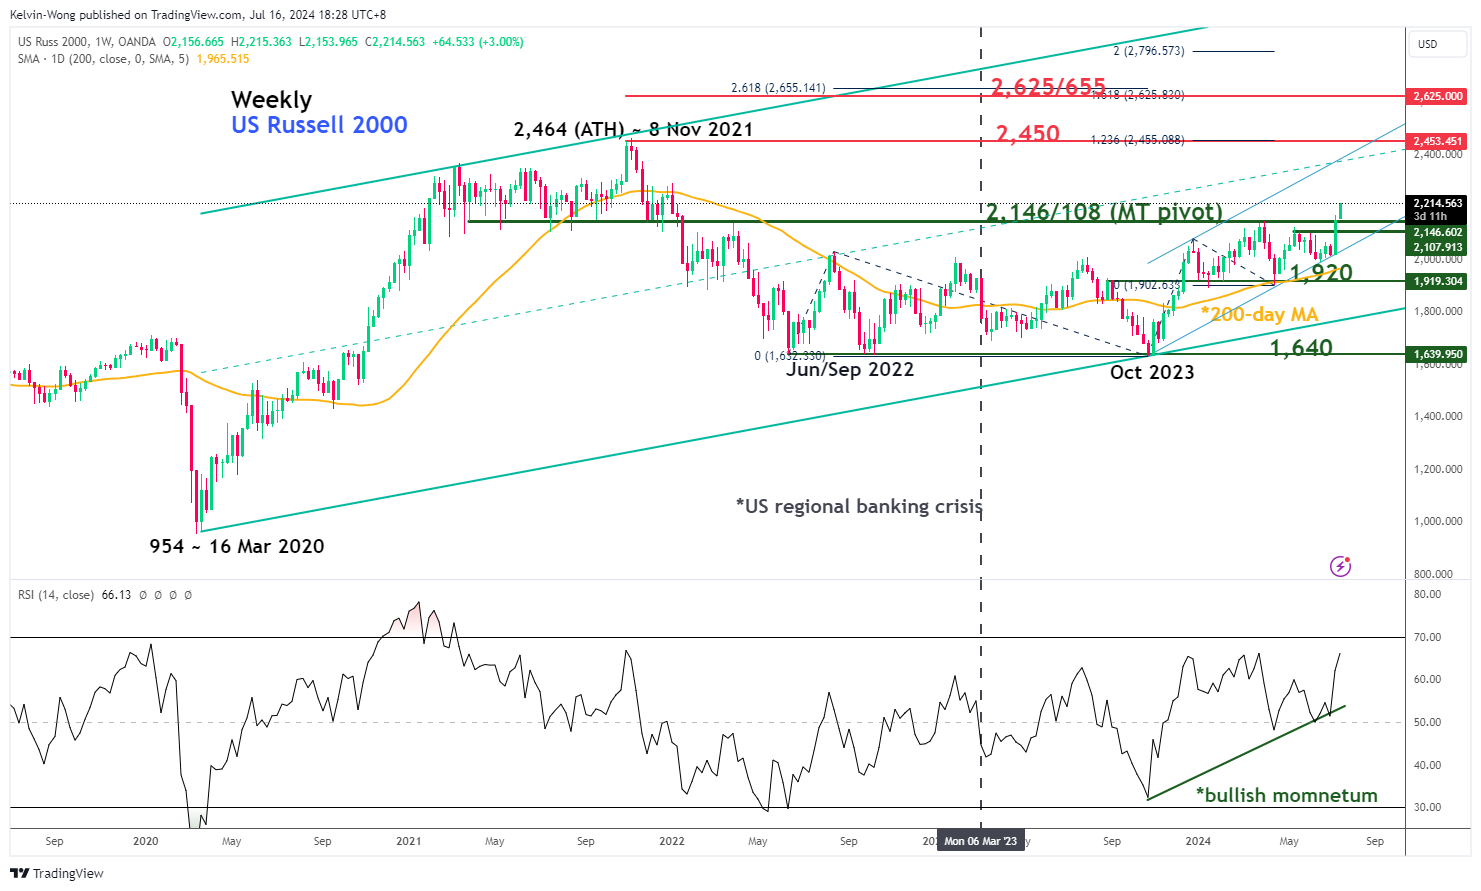
Fig 3: US Russell 2000 major & medium-term trends as of 16 Jul 2024 (Source: TradingView, click to enlarge chart)
In the lens of technical analysis, the latest price actions of the US Russell 2000 CFD Index (a proxy of the E-mini Russell 2000 futures) staged a bullish breakout last Friday, 12 July from a 2-year range configuration since June 2022.
Its price action has a positive following through on Monday, 15 July which suggests the Index is likely to kickstart a potential medium-term impulsive upmove sequence.
If the 2,146/108 key medium-term pivotal support holds, the Index may see a retest on its current all-time high area of 2,450 and above it sees the next medium-term resistance zone coming in at 2,625/655 (see Fig 3).
On the flip side, a reintegration below 2,108 signals a failure bullish breakout where the price actions may resume their choppy corrective downside move to expose the next medium-term support at 1,920 (also close to the 200-day moving average) in the first step.
Content is for general information purposes only. It is not investment advice or a solution to buy or sell securities. Opinions are the authors; not necessarily that of OANDA Business Information & Services, Inc. or any of its affiliates, subsidiaries, officers or directors. If you would like to reproduce or redistribute any of the content found on MarketPulse, an award winning forex, commodities and global indices analysis and news site service produced by OANDA Business Information & Services, Inc., please access the RSS feed or contact us at info@marketpulse.com. Visit https://www.marketpulse.com/ to find out more about the beat of the global markets. © 2023 OANDA Business Information & Services Inc.

Kelvin Wong
Passionate about connecting the dots in the financial markets and sharing perspectives around trading and investment, Kelvin Wong is an expert in using a unique combination of fundamental and technical analyses, specializing in Elliott Wave and fund flow positioning, to pinpoint key reversal levels in the financial markets.
In addition, over the last ten years, Kelvin has conducted numerous market outlook and trading-related seminars, as well as technical analysis training courses, for thousands of retail traders.
Latest posts by Kelvin Wong (see all)
- Nasdaq 100 Technical: At risk of staging a multi-week corrective decline - 20 December 2024
- Gold Technical: A less dovish Fed may reinforce a medium-term corrective decline - 16 December 2024
- AUD/USD: Surviving at the 0.6360 key support (for now) but the long-term trend remains bearish - 13 December 2024