- Nvidia’s Q2 earnings beat estimates, but forward guidance disappoints.
- Other semiconductor stocks, like Broadcom, show positive performance despite Nvidia’s mixed guidance.
- The S&P 500 eyes fresh all-time highs, with immediate support at 5538.
Most Read: Bitcoin Price Analysis: Key Support Levels and Market Trends Amidst Major Transactions
The S&P 500 and Nasdaq 100 roared back to life on Thursday after a slight blip as Nvidia’s forward guidance pointed to a slowdown in growth in 2025. Nvidia smashed its Q2 earnings estimates yesterday and announced a share buyback and yet markets appeared to be paying largely unfazed.
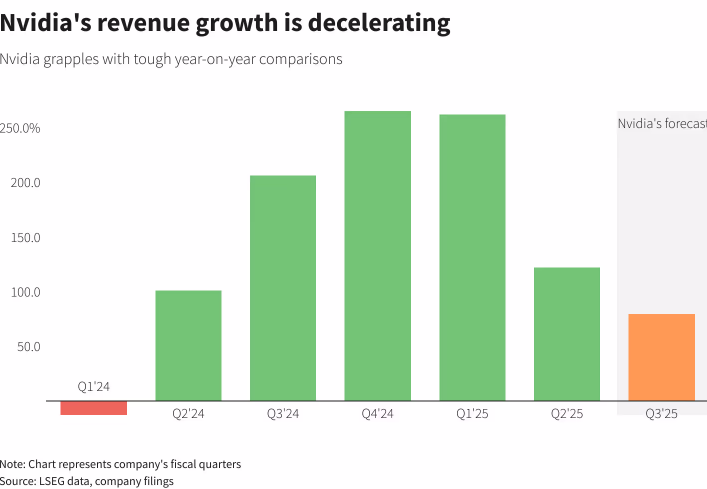
Source: LSEG Workspace
Nvidia’s forward guidance underwhelmed with many market participants looking for a better forecast. At the time of writing, Nvidia was down around 2.97%. Wall Street banks all raised their price target on Nvidia. Bank of America and Wells Fargo both with a price target of $165.
Despite the uncertainty, other semiconductor stocks have enjoyed a positive day with Broadcom up around 1.7%.
S&P 500 Early Session Heatmap
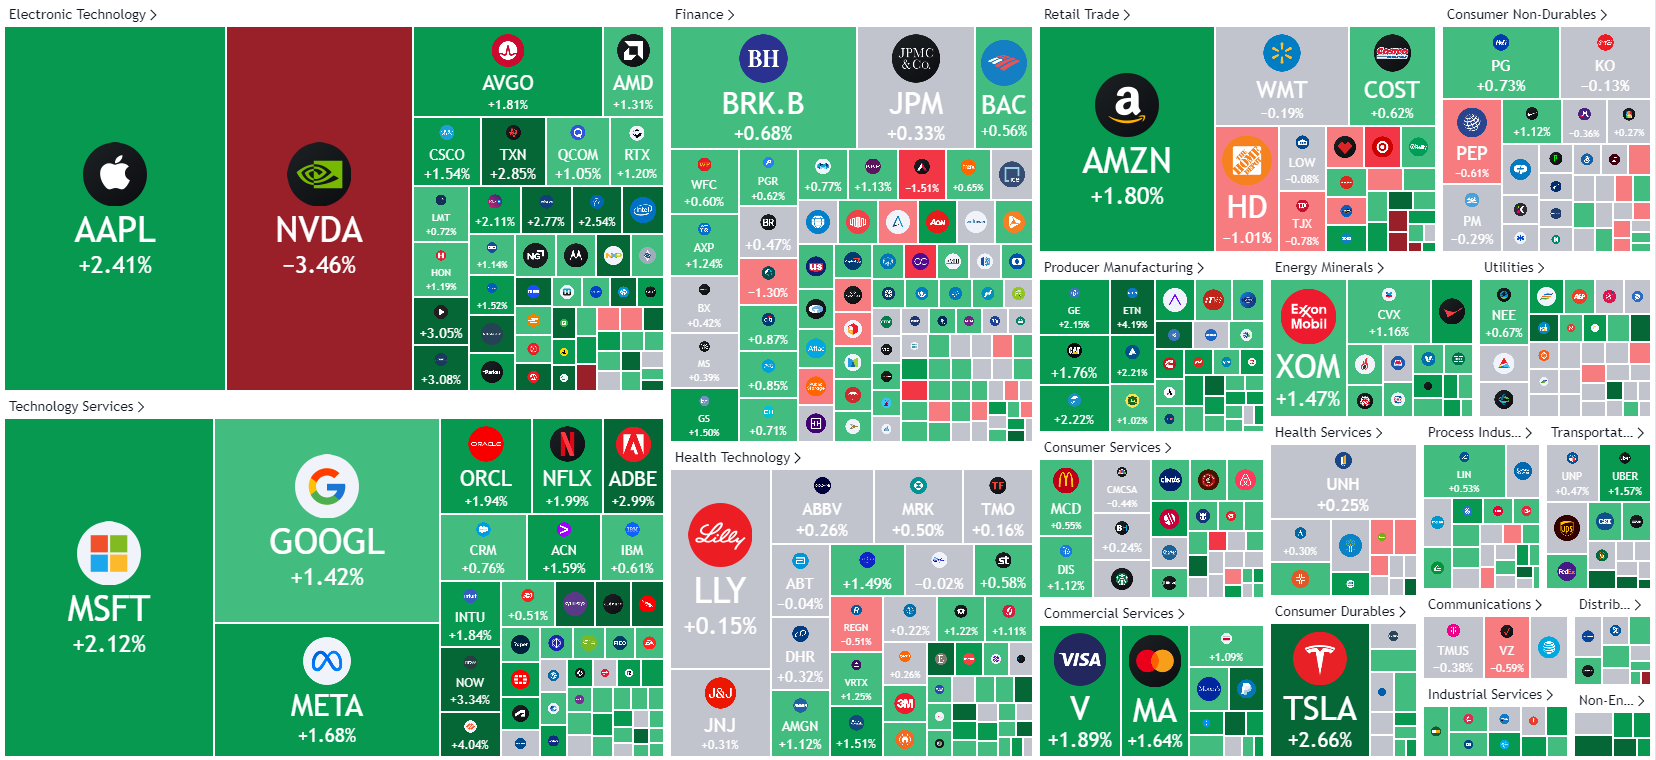
Source: TradingView
Quick Recap of Earnings Season
This earnings season has seen a market dip and some less-than-stellar results, but the main takeaway is positive. Earnings are growing faster than they have in years, and they’re expected to pick up even more speed in the fourth quarter and into 2025. While there’s more volatility and uncertainty, businesses are slowly getting back to normal, and the market seems set to overcome its current worries. The biggest uncertainty lying ahead in Q4 is undoubtedly the US election and the continued threats of wider geopolitical conflict, both of which could have a negative impact on consumers.
Technical Analysis
S&P 500
From a technical perspective, the S&P is eyeing fresh ATH as the index approaches the current all-time highs (ATH) at 5669. Following a few days of consolidative price action, the S&P is on course for a bullish engulfing daily candle close off a key area of support.
Immediate support rests at 5538 and of course the psychological 5500.
A break above the current ATH at 5669 makes it a bit more challenging to find key levels. I will focus on the whole numbers initially such as the 5700 level for some resistance.
S&P 500 Daily Chart, August 29, 2024
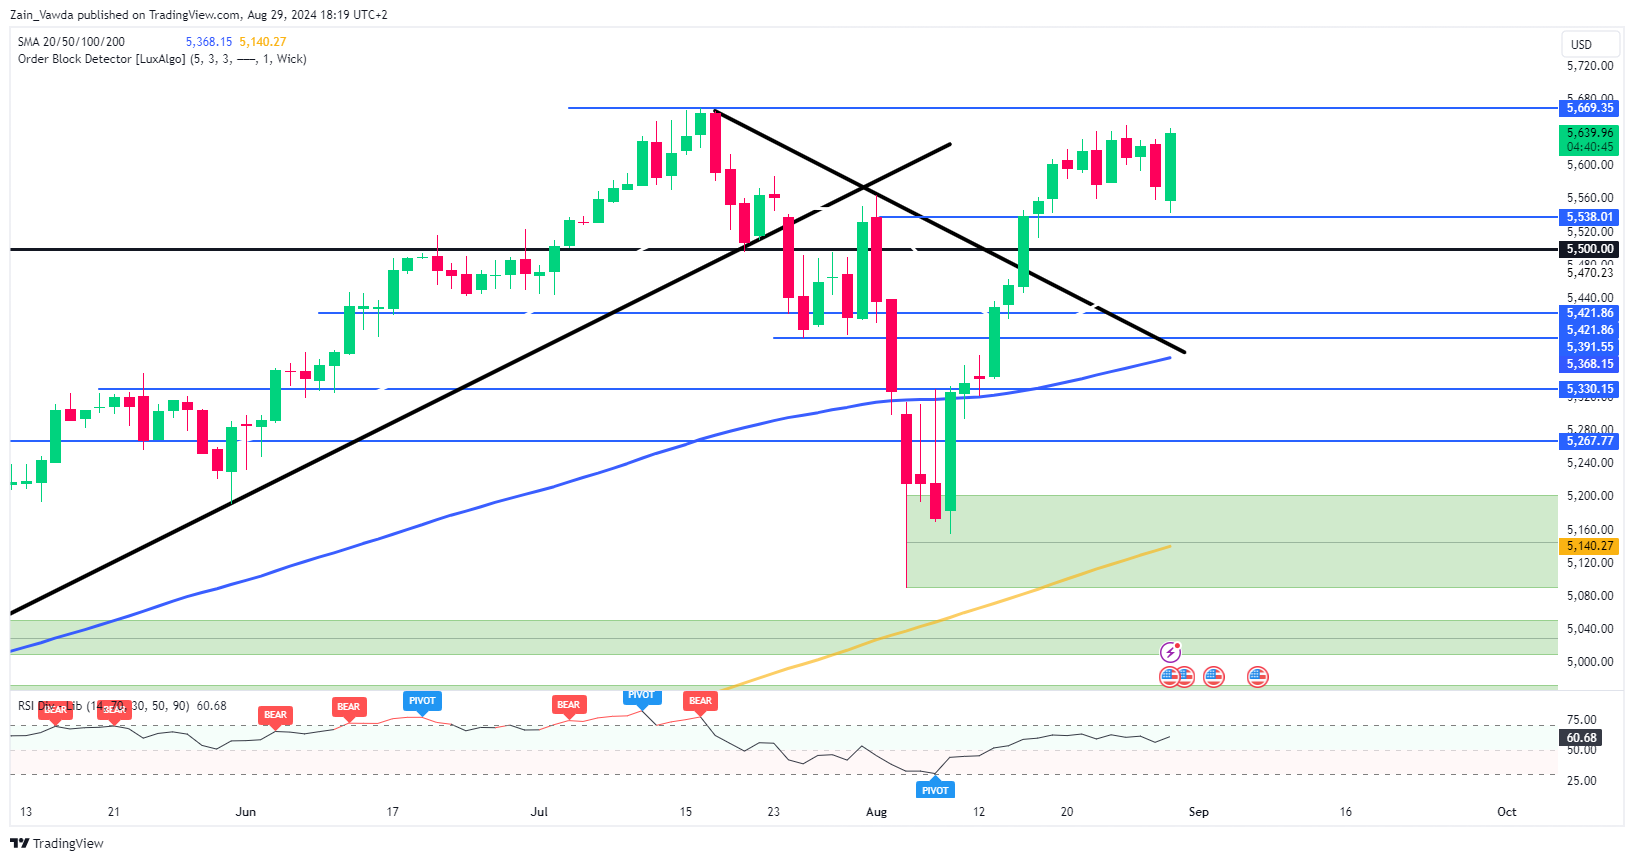
Source: TradingView (click to enlarge)
Support
- 5600
- 5538
- 5500
Resistance
- 5669
- 5700
- 5750
Nasdaq 100
From a technical perspective, the Nasdaq 100 on a daily timeframe changed structure with a daily close above the 19474 swing high on August 16. This was followed by an attempt to test the 20000 psychological level which failed to materialize as the index reached a high of 19951.
This was followed by a pullback which also stopped just short of the 100-day MA resting just below the 19000 handle. Similar to the S&P, a bullish engulfing daily candle close appears on the cards which makes a break of the 20000 handle look more appealing.
A break above the 20000 handle will find some resistance at the 20484 swing high from July 15 before the all time highs around 20790 comes into focus.
Conversely, a failure to push on from here will first need to navigate its way past the confluence area around 19000 before the 18416 support area comes into focus.
Nasdaq 100 Daily Chart, August 29, 2024
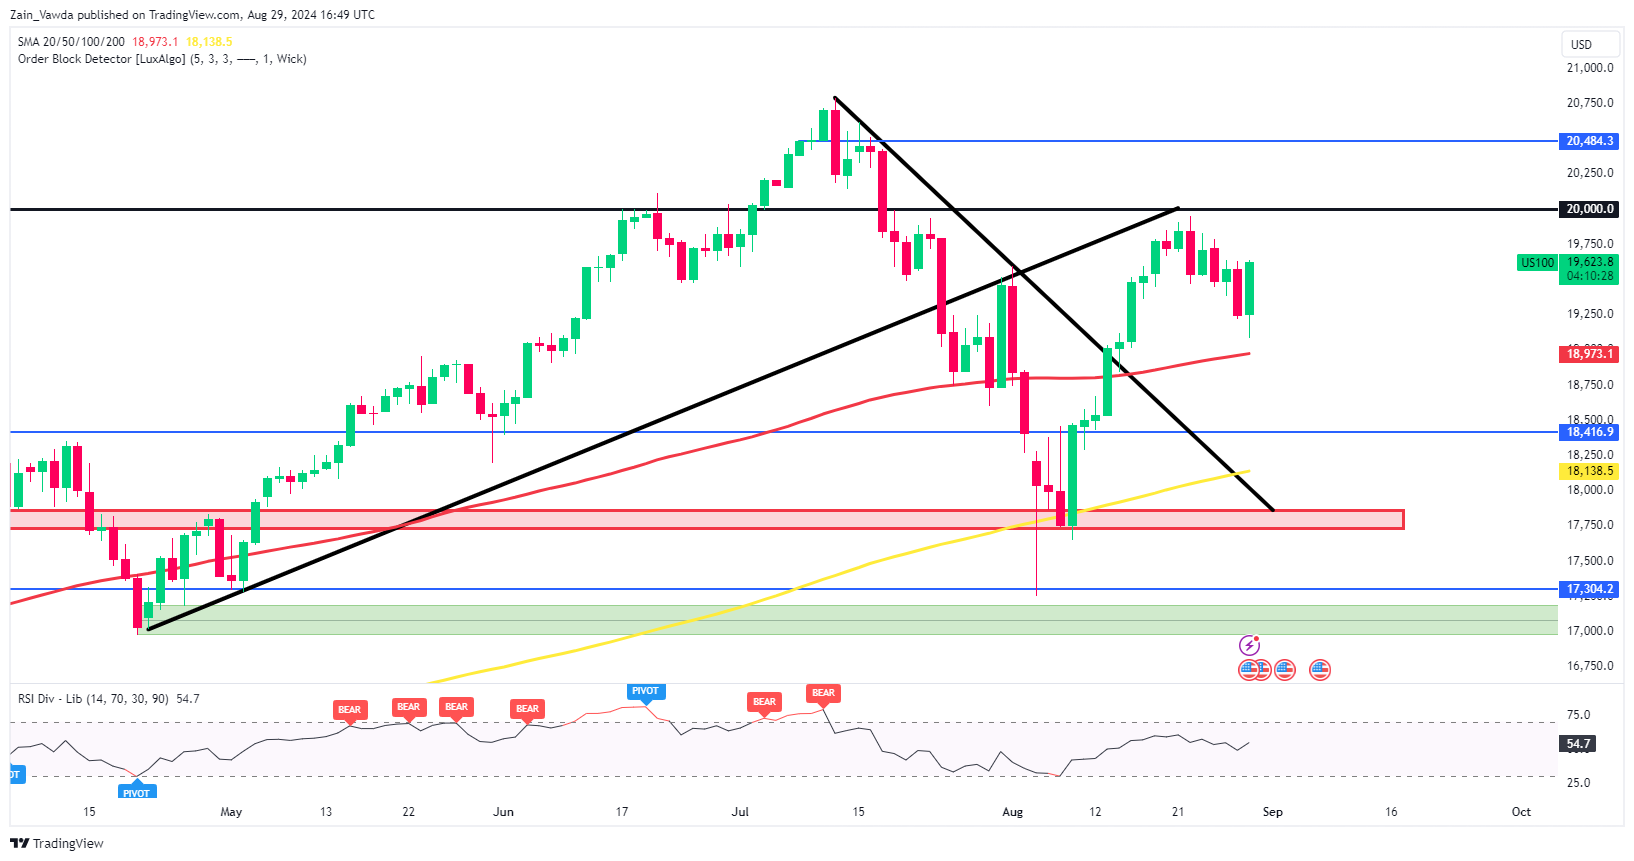
Source: TradingView (click to enlarge)
Support
- 19460
- 19000
- 18416
Resistance
- 20000
- 20484
- 20790
Follow Zain on Twitter/X for Additional Market News and Insights @zvawda
Content is for general information purposes only. It is not investment advice or a solution to buy or sell securities. Opinions are the authors; not necessarily that of OANDA Business Information & Services, Inc. or any of its affiliates, subsidiaries, officers or directors. If you would like to reproduce or redistribute any of the content found on MarketPulse, an award winning forex, commodities and global indices analysis and news site service produced by OANDA Business Information & Services, Inc., please access the RSS feed or contact us at info@marketpulse.com. Visit https://www.marketpulse.com/ to find out more about the beat of the global markets. © 2023 OANDA Business Information & Services Inc.

Zain Vawda
He has spent the last 3 years in an analyst role honing his skills across various financial domains, including technical analysis, economic data interpretation, price action strategies, and analyzing the geopolitical impacts on global markets. Currently, Zain is advancing in obtaining his Capital Markets & Security Analyst (CMSA) designation through the Corporate Finance Institute (CFI), where he has completed modules in fixed income fundamentals, portfolio management fundamentals, equity market fundamentals, introduction to capital markets, and derivative fundamentals.
He is also a regular guest on radio and television programs in South Africa, providing insight into global markets and the economy. Additionally, he has contributed to the development of a financial markets course approved by BankSeta (Banking Sector Education and Training Authority) at NQF level 6 in South Africa.
Latest posts by Zain Vawda (see all)
- Markets Weekly Outlook – S&P 500 in Focus as Markets Brace for Holiday Lull - 20 December 2024
- Stagflation Fears and Soaring US Yields: S&P 500’s Next Move - 19 December 2024
- Brent Crude Oil Prices Toil as Market Awaits Fed Decision. Range Trading Ahead? - 18 December 2024