- US banking systemic risk has toned down in the last two weeks.
- US corporate credit crunch risk is still a live event.
- A widening of the US high-yield corporate bonds credit spread may trigger a downturn in US small-cap equities (Russell 2000).
A month has passed since the mini risk-off episode that shook the international financial markets triggered by the turmoil seen in the US regional banks due to the mismanagement of duration risk on their respective balance sheets.
So far, any outburst of systemic risk in the US banking system has subsided as indicated by the Cleveland Fed’s Systemic Risk Indicator derived from market participants’ sentiment reflected in the prices of options.
How do we interpret the Systematic Risk Indicator?
To sum up briefly; this risk indicator has three components, (1) the average distance-to-default (ADD) of a sample of approximately 100 US banks, (2) the portfolio distance-to-default (PDD) of the same sample banks, and (3) the spread or difference between ADD and PDD.
ADD captures the average insolvency risks, a falling ADD value (measured in standard deviations) indicates the market’s perception of average insolvency risk is raising.
PDD captures insolvency risk for a weighted portfolio of the same sample banks. Falling PDD (measured in standard deviations) is another indication of rising average insolvency risk.
The spread (ADD – PDD) is the most useful measure; narrowing the spread when falling PDD convergences towards ADD indicates stress in the banking system.
Data from 2000 to the present indicate that when the spread (ADD – PDD) is less than 0.1 for more than two days it indicates stress, and if it stays below 0.5 for an extended amount of time, it indicates that the markets are signaling major stress about the banking system.
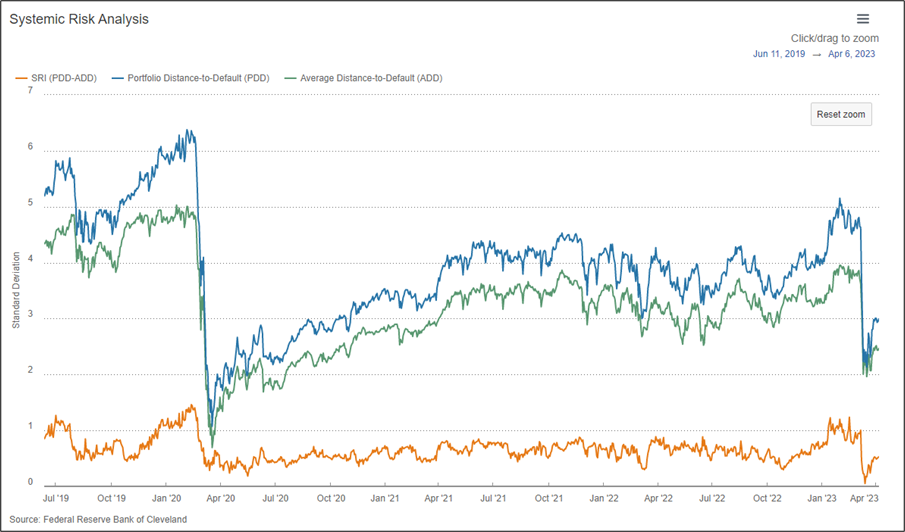
Fig 1: Cleveland Fed’s Systemic Risk Indicator as of 12 Apr 2023 (Source: Federal Reserve Bank of Cleveland, click to enlarge chart)
As seen from the above chart, the spread (ADD – PDD) of the Cleveland Fed’s Systemic Risk Indicator as of 12 April 2023 has increased to 0.5 from 0.0 printed on 15 March.
Compressed US high-yield corporate bonds credit spread at risk of widening
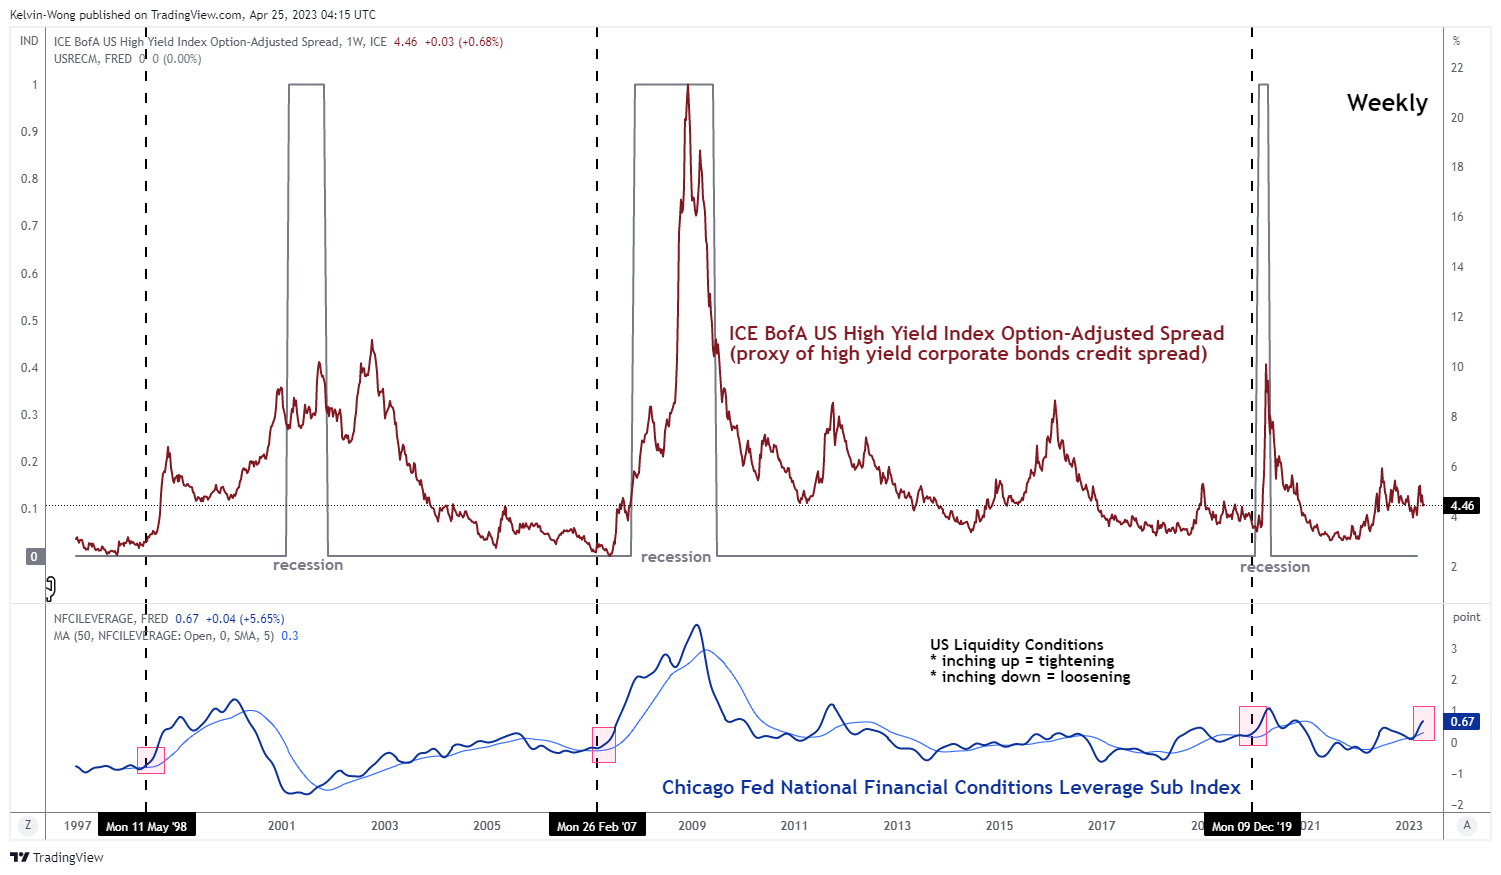
Fig 2: ICE BofA US high yield index option-adjusted spread & Chicago Fed NFCI Leverage sub-index as of 21 Apr & 14 Apr 2023
(Source: TradingView, click to enlarge chart)
The ICE BofA US High Yield Index option-adjusted spread (a proxy of high-yield US corporate bond credit spread) has started to inch lower towards 4.46 after it hit a high of 5.17 during the week of 13 March 2023 on the onset of the bank run crisis faced by US regional banks; Silicon Valley Bank and Signature Bank.
An up move in the ICE BofA US High Yield Index option-adjusted spread represents a widening of the credit spread (corporate bond yield – US Treasury yield) that indicates an increase in default risk for US high-yield corporate bonds, and vice versa for a narrowing of the credit spread where default risk decreases.
Even though the systemic risk in the US banking sector has toned down as highlighted earlier, the risk of a rising credit crunch is still a “live event” where banks cut back on loans which in turn triggers a negative ripple effect on economic and profit growth for corporates.
One of the ways to gauge credit crunch risk is to use financial conditions indicators such as the Chicago Fed’s National Financial Conditions Index where its leverage subindex component consists of debt and equity measures, it has started to trend higher to 0.67 based on current data for the week ended 14 April 2023 that surpassed the previous peak of 0.46 printed on the week of 11 July 2022.
Interestingly, the latest observation on the Chicago Fed’s National Financial Conditions Leverage Sub Index has preceded a significant widening of the ICE BofA US High Yield Index option-adjusted spread thereafter in periods of 11 May 1998, 26 February, and 9 December 2012. Hence, we cannot rule out the possibility that a similar imminent widening of the US high-yield corporate bonds credit spread may occur at this juncture.
Why does it matter to US small-caps equities?
The US small-cap listed companies as represented by Russell 2000 benchmark stock index tend to have weaker pricing power, lower margins, and a weaker balance sheet compared to their large-cap counterparts, resulting in conditions that are disadvantageous in face of a widening of US high-yield corporate bonds credit spread that implies a rise in default risk of small-cap companies as most of these firms have similar credit ratings that are below investment grade.
Also, these small-cap listed companies face higher downside repricing risk on their equity values as the 12-month forward price-to-earnings (PE) ratio of the Russell 2000 is much “higher/richer” versus the S&P 500 at 22.00 versus 18.2 based on data from Yardeni Research as of 24 April 2023.
Hence, the Russell 2000 faces a higher risk of underperformance against the S&P 500 if the US high-yield corporate bonds credit spread starts to widen significantly due to mispricing and over-optimism of a Fed pivot for a fresh interest rate cut cycle to kickstart in 2023.
US Russell 2000 Technical Analysis – eyeing a possible retest on its major range support
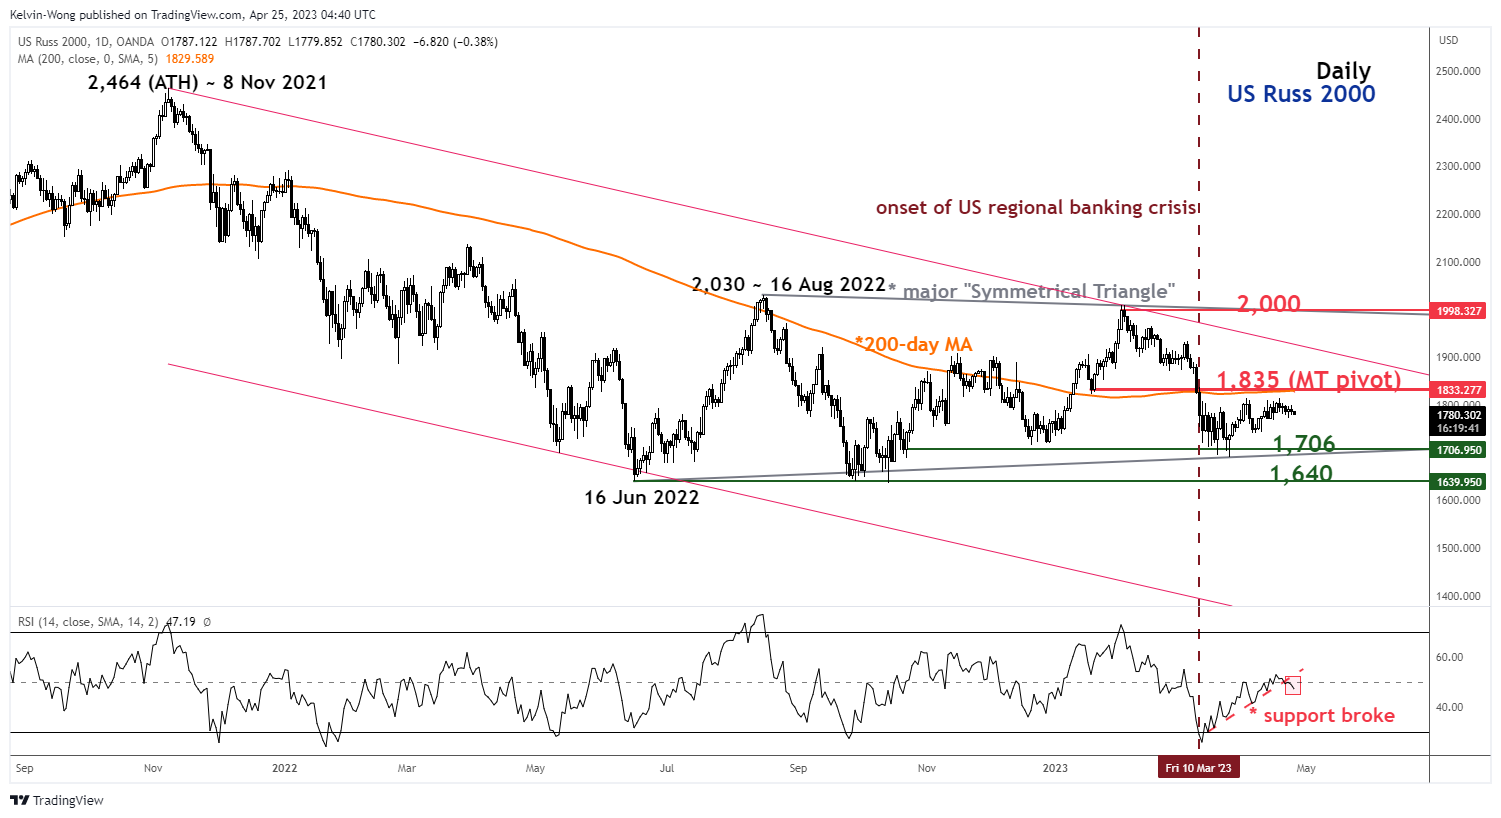
Fig 3: US Russell 2000 trend as of 25 Apr 2023 (Source: TradingView, click to enlarge chart)
Since its 16 June 2022 swing low of 1,640, the US Russ 2000 Index (a proxy for Russell 2000 futures) has started to evolve into a major “Symmetrical Triangle” range configuration which suggests a kind of breather sideways range after its prior major downtrend phase that occurred from 8 November 2021 all-time high of 2,464 to 16 June 2022 low.
The recent minor bounce on 24 March 2023 from its lower boundary/support of the “Symmetrical Triangle” has failed to make any breakthrough about the key 200-day moving average that acts at a resistance at around 1,835.
In addition, the RSI oscillator has just broken its corresponding support at the 50% level which suggests weakness in the price actions of the Index. If the 1,835 key medium-term pivotal resistance is not surpassed to the upside, the Index may see a retest on the “Symmetrical Triangle major range support at 1,706. However, a clearance above 1,835 negates the short-term bearish tone with the next resistance to watch at 2,000 (the upper boundary of the “Symmetrical Triangle” and the 2 February 2023 swing high area).
Content is for general information purposes only. It is not investment advice or a solution to buy or sell securities. Opinions are the authors; not necessarily that of OANDA Business Information & Services, Inc. or any of its affiliates, subsidiaries, officers or directors. If you would like to reproduce or redistribute any of the content found on MarketPulse, an award winning forex, commodities and global indices analysis and news site service produced by OANDA Business Information & Services, Inc., please access the RSS feed or contact us at info@marketpulse.com. Visit https://www.marketpulse.com/ to find out more about the beat of the global markets. © 2023 OANDA Business Information & Services Inc.

Kelvin Wong
Passionate about connecting the dots in the financial markets and sharing perspectives around trading and investment, Kelvin Wong is an expert in using a unique combination of fundamental and technical analyses, specializing in Elliott Wave and fund flow positioning, to pinpoint key reversal levels in the financial markets.
In addition, over the last ten years, Kelvin has conducted numerous market outlook and trading-related seminars, as well as technical analysis training courses, for thousands of retail traders.
Latest posts by Kelvin Wong (see all)
- Nasdaq 100 Technical: At risk of staging a multi-week corrective decline - 20 December 2024
- Gold Technical: A less dovish Fed may reinforce a medium-term corrective decline - 16 December 2024
- AUD/USD: Surviving at the 0.6360 key support (for now) but the long-term trend remains bearish - 13 December 2024