Aussie Dollar traded higher on Monday open following a stronger than expected Chinese Non-Manufacturing PMI which was released over the weekend. Service sector in China reflected stronger growth rates for the month of October, coming in at 56.3 versus September’s 55.4. This came hot on the heels of last Friday’s Manufacturing PMI which was similarly higher than expected, painting an optimistic picture of China’s economic health.
Australian stocks rallied as well, breaking the 2 day losing streak – highlighting the strong bullish sentiment coming out from Australia, and a good sign that the initial rally is no fluke. Furthermore, fundamentals within Australia appears to be brightening with latest Retail Sales numbers stronger than expected. Q3 Retail Sales (excluding inflation) grew 0.7% Q/Q, reversing previous quarter’s loss and stronger than the 0.2% forecast. M/M data is healthy too, with a 0.8% gain for the month of September, double that of the 0.4% expectation, and all the more impressive considering that August’s data has been revised higher to 0.5% as well.
On the housing front, Q3 House Price Index rose at a lesser pace than expected – good news for the economy as the threat of the economy bubbling out of control becomes lesser. This generally would have meant weaker Aussie dollar, as it would mean that Central Bank RBA will have wider scope for the much needed easing. However in this case, short-term sentiment is bullish AUD as market is focusing on the bullish economy feel-good factor and not RBA rates outlook.
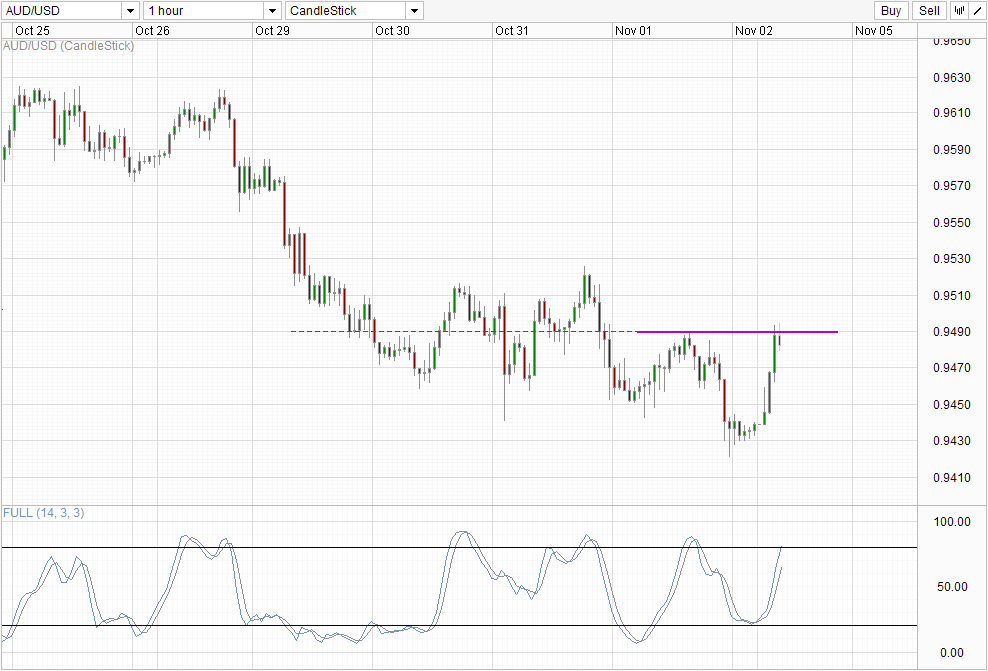
Hourly Chart

Nonetheless, there are signs that this short-term rally may be topping. Prices have found resistance around 0.949 soft-ceiling with Stochastic readings entering Overbought region. Even if prices manage to break 0.949, 0.950 will provide a yet more sterner test and so will the swing high of 31st October.
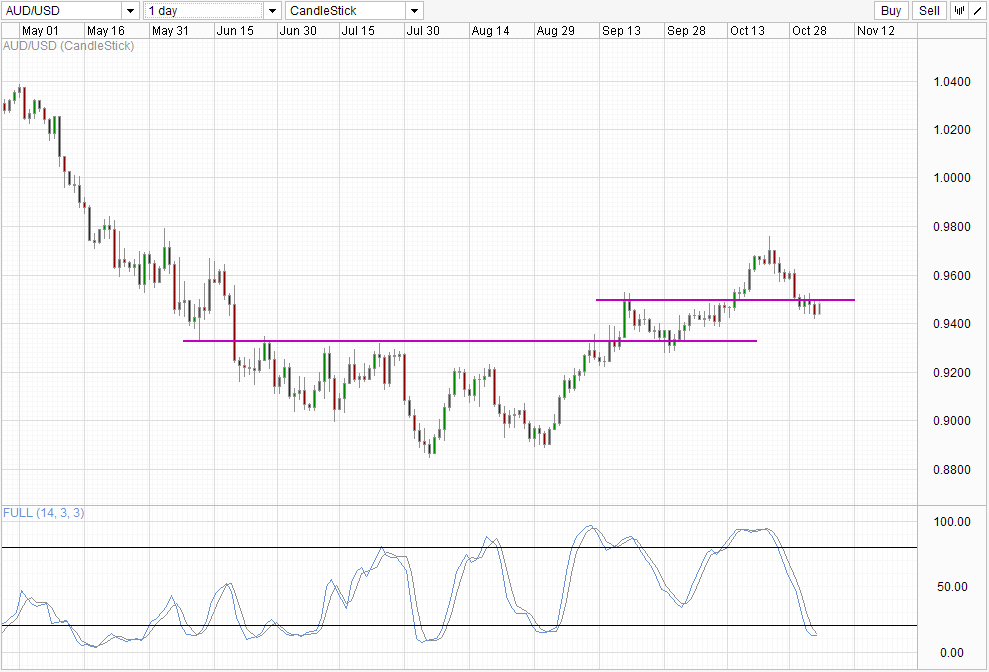
Daily Chart
Daily Chart is bullish though, with the rally from September remaining in play. Prices may have traded below the 0.95 round figure and swing high of 19th-20th September, but current pullback remains above the 38.2% Fib (from 1st Sep low and 23rd Oct high – not shown on chart), with Stochastic readings flattening and looking likely to revert higher.
On the sentiment front, latest Commitment of Traders data is at the least bearish since May 2013, while volume has been picking up since the start of October – a good sign that institutional speculators are buying AUD/USD on current dip. This increases the likelihood of a bullish acceleration should 0.95 is broken, and suggest that further dips (if any) will be broadly supported.
Nonetheless, it is important to note that long-term trend remains lower and it is hard to see current rally as anything but corrective as long as we trade below 0.975. Furthermore, as mentioned above, the likelihood of RBA lowing rates once more in the next few months have increase and will grow further if Housing Prices growth remain subdued. Considering that rate expectations for neighbors RBNZ have decreased significantly, it is a matter of time before market start to speculate on RBA rate cut scenarios, which will likely trump any bullish factor a stronger Australia economy can bring for AUD.
More Links:
Week in FX Europe – Expensive EUR ‘Puts,’ Dovish ECB Gives Us A Lower EUR
Week in FX Americas – Fed Statement and Weak European Data Boost USD
Week in FX Asia – China: Be Sure To Read Between The Lines
This article is for general information purposes only. It is not investment advice or a solution to buy or sell securities. Opinions are the authors; not necessarily that of OANDA Corporation or any of its affiliates, subsidiaries, officers or directors. Leveraged trading is high risk and not suitable for all. You could lose all of your deposited funds.


