Many commodities are falling victim to the dollar’s strength as risk-aversion trades gain popularity. Most agricultural assets are suffering from supply overhangs while metals continue to take the cue from gold and head lower. Oil prices have struggled to rally despite some supply-side issues.
Precious metals
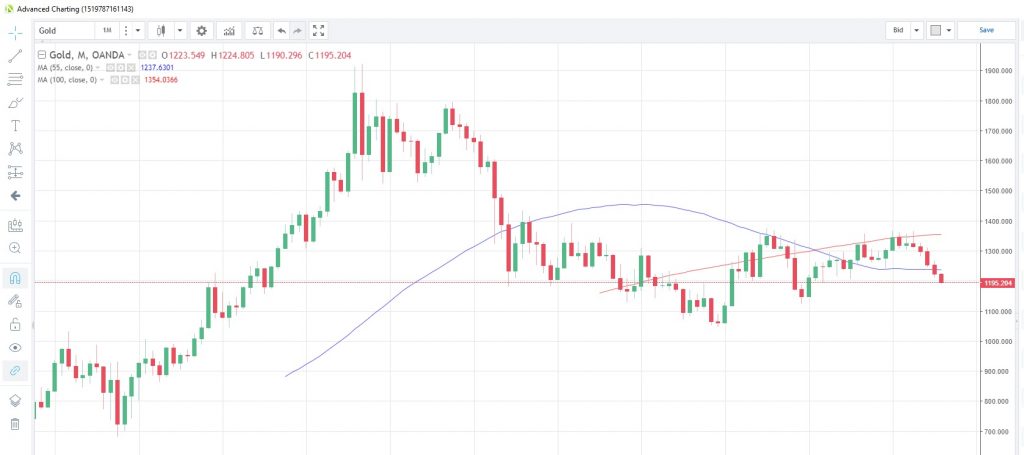
GOLD broke through the 1,200 mark yesterday for the first time since March 2017 as it continued to be pressured by the dollar’s steady rise on safe haven flows. In the latest data from CFTC as at August 7, short positions built up by speculative traders were at their highest since data began in 2006, according to data compiled by Bloomberg. Overall however, net positioning is still long by 12,688 contracts, which is still the least since December 2015.
Gold holdings by SPDR Gold Trust GLD, the world’s largest gold-backed exchange-traded fund, are at the lowest since 2016 as the fund saw more than $1 billion worth of withdrawals in Q2, Bloomberg reports.
Monthly Gold Chart
SILVER continues to shy away from the 55-day moving average, echoing the sentiment in gold. Speculative accounts reduced their net long positions by 1,523 contracts in the week to August 7, according to latest data released on Friday, with most of the adjustment coming from an increase in short positions rather than liquidating longs. The gold/silver (Mint) ratio is higher this week, gaining to 79.360 from 78.805 at last week’s close.
PLATINUM is hovering near 10-year lows having failed to reach the downward-sloping 55-day moving average, which is currently at 852.54. The dollar’s strength has had a part to play in the bearish bias, though the cloudy industrial demand outlook given the ongoing trade wars also pressures. The metal is currently trading at 799.87 with the July 19 low of 792.64 a mild support point.
PALLADIUM is still in a broader downward trend as it continues to retrace the rally in the second half of July. The commodity has breached the 61.8% Fibonacci level at 891.60 and is currently trading at 889.95. Speculative accounts increased their short positions by 1,207 contracts in the week to August 7, latest CFTC data shows.
Base metals
COPPER markets continue to be plagued by the threat of strike action at some of the world’s largest mines. BHP is waiting to hear the response to its sweetened offer to workers at its Escondida mine in hopes of averting a strike, while strikers at the Caserones mine are set to go on strike on August 14 if mediation fails. Despite these potential supply disruptions, copper is struggling to gain any kind of foothold with a one-day spike higher on August 9 beaten back the following day. The base metal is facing its third straight down day and is now at 2.7102. The July 19 low of 2.6501 could be the next support level.
Energy
OIL prices are on the defensive with WTI sliding to a seven-week low overnight as markets consider the broader impact of the meltdown in the Turkish currency and economy. Additional pressure has come from the dollar’s bid bias as a safe haven stronghold, while a weekend IEA oil market report predicted that global demand for oil would slacken for the rest of this year before reviving next year. The combined downward pressure was strong enough to overcome reports that Saudi Arabia’s production has been scaled back in July even as Iran sanctions kick in.
WTI is now at 67.732 and has traded below the 100-day moving average, currently at 68.495, for the last four days. The Brent/WTI spread has moved back above the 4.0 mark, to 4.8 currently, after a brief dip below last week. The weekly EIA crude inventory data is due tomorrow and is expected to show a rebuild of 1.2 million barrels, according to the latest survey of analysts, after last week’s drawdown.
NATURAL GAS is holding just below seven-week highs touched last week as it looks to extend the rally started in the middle of last month. The rally comes despite reports that China’s PetroChina is considering suspending all US gas purchases as part of the US-China tariff war.
Natural Gas inventories rose to 46 billion cubic feet in the week to July 30, according to EIA data released August 9. The commodity is currently trading at 2.934 and is looking to test the 100-month moving average which is currently at 3.0126.
Agriculturals
SUGAR continues its downward trend amid no letup in supply and building of stockpiles. India’s farm ministry reported on Friday that its monsoon-sown crop area had risen to 5.06 million hectares, up from just below five million last time. Sugar is now at 0.1015 after touching 0.1007 earlier today, the lowest since August 2015. That low was 0.1002 and may provide support at the next test.
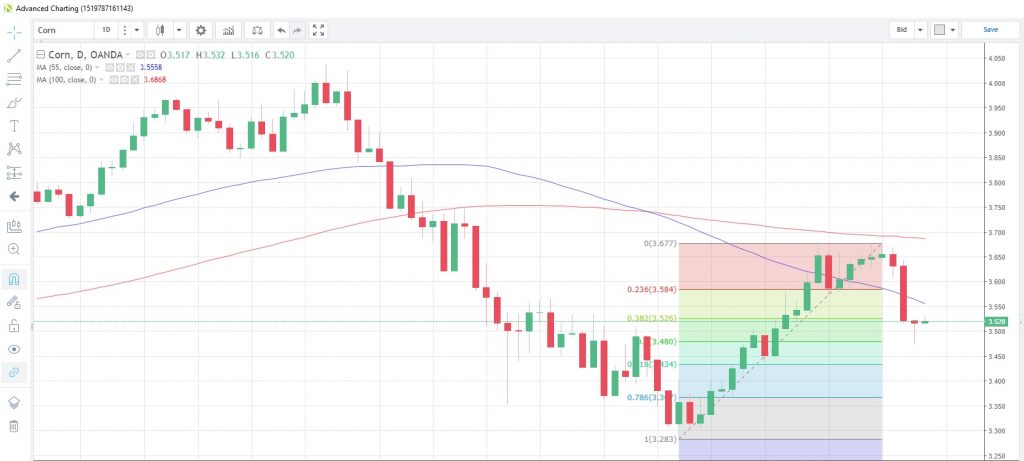
CORN yields are seen higher than a year ago with the majority of US producing-States expecting higher harvests, according to the latest crop report from the US Department of Agriculture. US exports are expected to rise reflecting US competitiveness and reduced competition from Brazil. The season-average corn price received by producers is calculated to be down 20 cents at the midpoint in a range of $3.10 to $4.10 per bushel. Corn is now at $3.522 as it holds above the 50% retracement level of the rally from July 12 to August 8.
Daily Corn Chart
SOYBEANS may struggle to overcome the 55-day moving average, which has capped prices since May 30, after the latest US Department of Agriculture’s WASDE report (world agricultural supply and demand estimates) predicted that soybean supplies for the 2018/19 season would reach a record 5,040 million bushels, 5% higher than last month’s forecast, while ending stocks are projected at 785 million bushels, up 205 million from last month. The average soybean price for the season is estimated to be $8.90 per bushel. The commodity is currently at 8.507.
WHEAT is in the process of retracing its advance to test the 100-month moving average earlier this month. The average now sits at 5.762 and the commodity managed a spike high of 5.807 on August 2 before retracing. Wheat is currently trading at 5.292 while the 55-day moving average lurks below at 5.049. The USDA August WASDE report was bullish for prices, forecasting lower supplies, greater use and reduced stockpiles. It estimates the season-average farm price is up $0.10 per bushel at the midpoint with the range at $4.60 to $5.60.
Content is for general information purposes only. It is not investment advice or a solution to buy or sell securities. Opinions are the authors; not necessarily that of OANDA Business Information & Services, Inc. or any of its affiliates, subsidiaries, officers or directors. If you would like to reproduce or redistribute any of the content found on MarketPulse, an award winning forex, commodities and global indices analysis and news site service produced by OANDA Business Information & Services, Inc., please access the RSS feed or contact us at info@marketpulse.com. Visit https://www.marketpulse.com/ to find out more about the beat of the global markets. © 2023 OANDA Business Information & Services Inc.


