Gold shines in the commodity space while silver and copper lag behind. Energy commodities are softer while the agriculture sector is mixed.
Precious metals
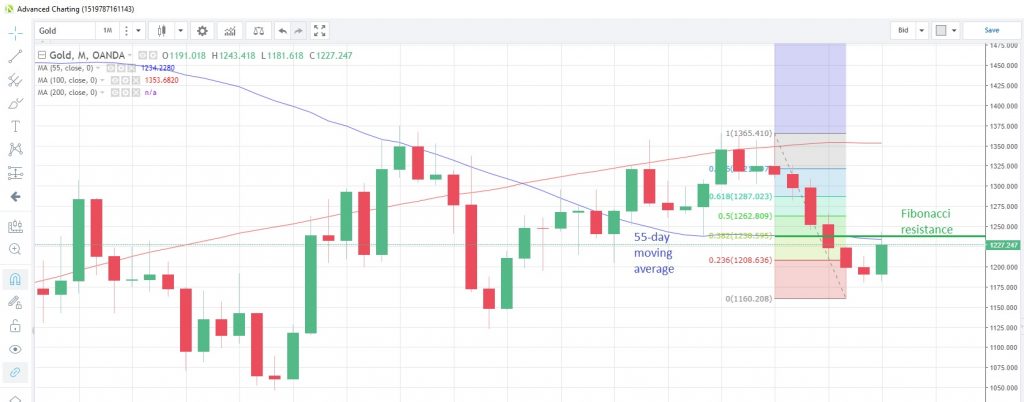
GOLD has a chance to record the biggest monthly gain since January as it regained its safe haven status, despite further gains for the commanding US dollar. XAU/USD touched the highest since July 17 last Friday and has consolidated lower this week. The precious metal appears to be struggling to breach Fibonacci resistance at 1,238.595, which is 38.2% retracement of the April to August drop, while the 55-month moving average is also proving to be a tough level to crack.
Gold Monthly Chart
Speculative traders continued to accumulate long positions and reduce short positions, with net longs at their highest since the week of July 4, according to the latest data snapshot as at October 23 published last Friday by CFTC.
SILVER has struggled to match gold’s gains, and is currently looking at a loss for the month. Speculative accounts scaled back net short positions to their lowest in 10 weeks in the latest reporting week, CFTC data shows, despite the lack any progress to the upside for the metal.
The gold/silver (Mint) ratio posted its biggest one-day rally since August 15 yesterday, as silver declined 1.36% versus the US dollar.
During the last week, PLATINUM has remained confined within the 800-850 trading corridor that has been in place since mid-September, with no news or developments to break the range. Speculative investors may have lost a bit of patience with the lack of upward progress and trimmed their net long positions for the first time in seven weeks, according to the latest CFTC data.
PALLADIUM is poised for the third monthly gain in a row as prices hit a record high, according to Oanda data going back to 2005. Speculative accounts probably see more upside as they added to net longs for the ninth straight week, bringing the net long positioning to its highest since June 12.
A recent Reuters poll conducted Monday suggested that Palladium’s premium over platinum will widen next year, with palladium set for a record year while platinum struggles with a worst performance since 2004.
Base metals
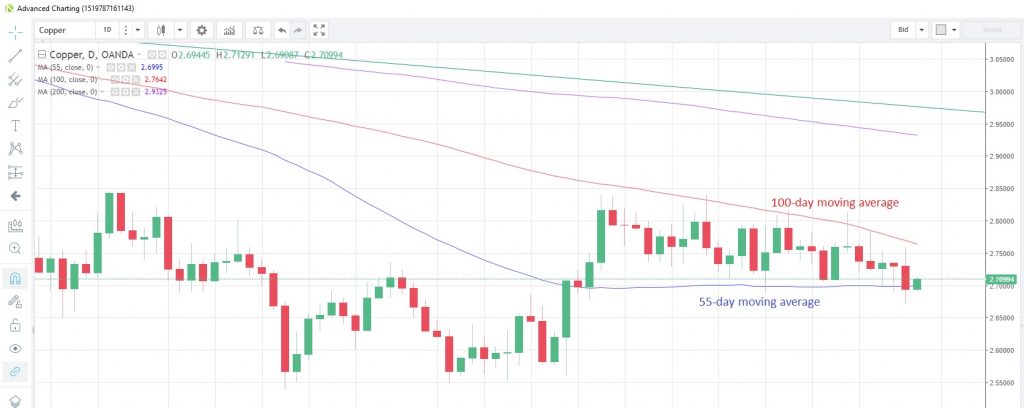
COPPER has been drifting lower during the past week and could be heading for its third weekly loss in a row, as slowing global GDP growth is registered in the third quarter, pressuring the outlook for industrial demand for the metal. The metal remains capped by the 100-day moving average at 2.7642, which has held on a closing basis since June 15. Speculative accounts remain net long, according to the latest CFTC data, and added to net long positions for a second straight week to October 23.
Copper Daily Chart
Energy
CRUDE OIL is hovering above two-month lows as the markets await the introduction of sanctions against Iran next week. Early fears of a supply shortage appear to have dissipated over the past four weeks, as prices fell from near-four year highs after Saudi Arabia and Russia assured markets of a ramp up in production. WTI has traded below the 200-day moving average for the past six days and that remains a resistance point at $67.63.
Today’s API weekly crude stocks as at October 26 and tomorrow’s EIA equivalent are the next data points that could move oil prices. Both showed an increase in inventories last week. The slew of global manufacturing PMIs due on Thursday could also influence.
NATURAL GAS has extended its decline from the nine-month high struck earlier this month as mild weather forecasts for early November in the US reduce expectations of demand for both cooling and heating. Gas has fallen as much as 8.6% from the October 9 high, and the next technical support point possibly lies at 3.071, the 50% retracement of the September 10 to October 9 rally.
Agriculturals
WHEAT saw the biggest one-day jump in two months last Friday on news that Egypt, the biggest global buyer of grains, had bought US wheat for the first time since the 2016-2017 season. Russia is normally Egypt’s biggest supplier, but local droughts that have reduced harvests and a decision to reserve some supply for the domestic market, have raised concerns about a supply shortage.
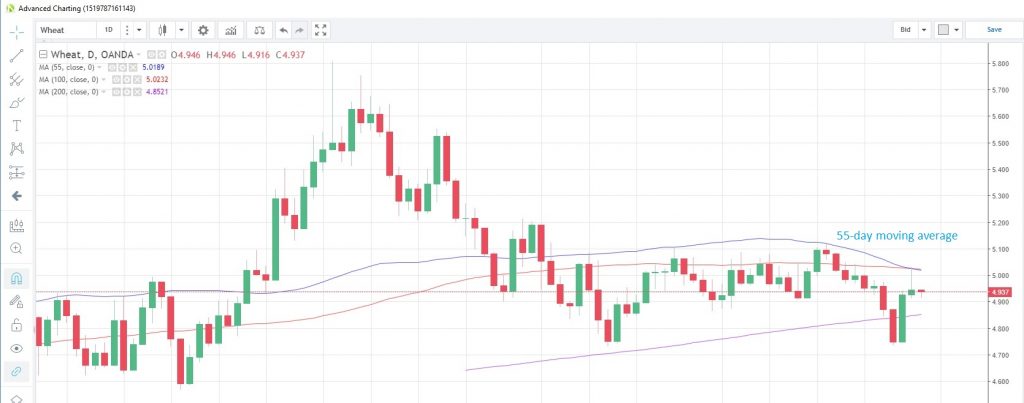
Money managers trading non-commercial wheat futures reduced their long positions and increased short positions in the week to October 23, latest CFTC data shows. Wheat has traded below the 55-day moving average, currently at 5.0189, since September 11 and this moving average has capped the commodity on a closing basis for the past two months.
Wheat Daily Chart
SUGAR has fallen for the past three days after touching the highest level since March 7 last week, and looks set for the biggest one-day decline in a month today. Sri Lanka’s decision earlier this month to hike import duties and set a maximum domestic retail price is starting to have an effect as Sri Lankan importers have temporarily stopped importing sugar. Forecasts of lower production from both Brazil and India have failed to sustain prices. Money managers increased their net long position by more than 53,000 contracts in the last reporting week to October 23, by a combination of both adding to longs and trimming shorts, according to CFTC data.
The US CORN harvest has moved past the halfway mark with 63% completed, which is better than expected, according to the latest USDA weekly crop report. The commodity remains sandwiched between support at the convergence of the 55- and 100-day moving averages in the 3.5071-76 window and resistance at the 55-day moving average of 3.6252.
In the same report, the SOYBEAN harvest is also going better than expected, with 72% of the crop harvested, though this still lags the five-year average of 81%, according to USDA. Prices remain slightly pressured this week and currently sit at 8.367
Content is for general information purposes only. It is not investment advice or a solution to buy or sell securities. Opinions are the authors; not necessarily that of OANDA Business Information & Services, Inc. or any of its affiliates, subsidiaries, officers or directors. If you would like to reproduce or redistribute any of the content found on MarketPulse, an award winning forex, commodities and global indices analysis and news site service produced by OANDA Business Information & Services, Inc., please access the RSS feed or contact us at info@marketpulse.com. Visit https://www.marketpulse.com/ to find out more about the beat of the global markets. © 2023 OANDA Business Information & Services Inc.


