The G-20 meeting is looming this weekend and is having an impact across the commodity space. Oil markets are bracing for production cuts, while the metals and agricultural spaces are hoping for good news on the US-China trade war front.
Energy
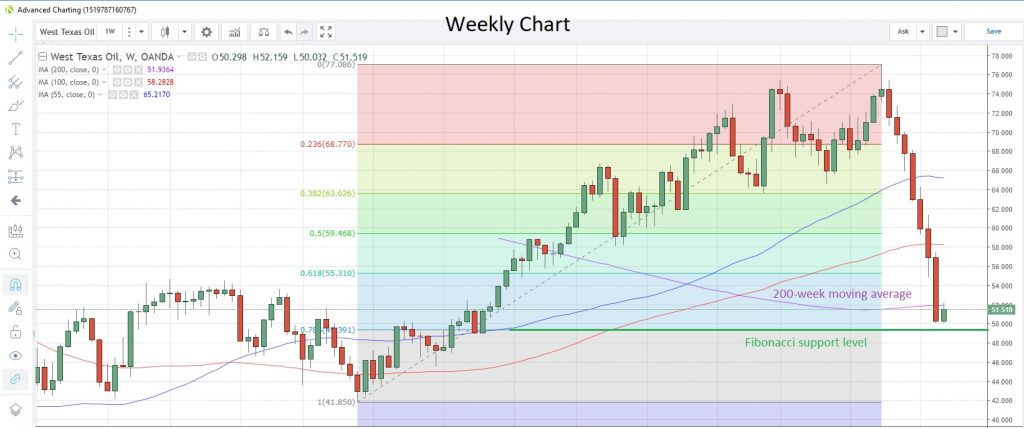
CRUDE OIL prices started off this week positively following a rout that lasted seven weeks and knocked about 35% off prices from October’s peak. Hopes for a breakthrough in US-China relations regarding trade at this weekend’s G-20 meeting have halted the slide, though it may be only temporary. However, parallels have been drawn to the situation surrounding the G-20 meeting in September 2016, where Saudi Arabia and Russia agreed to take 1.8 million barrels per day (bpd) off the market, and prices rose more than 20% in the next six months.
News that Saudi Arabia had pumped more than 11 million bpd in November did not help sentiment, though the Saudi oil minister has stated that the nation will not pump oil that nobody needs. Previously market talk was that Saudi Arabia planned to cut production by 500,000 bpd in December, with other OPEC members aiming to also cut production in 2019. The next official OPEC meeting is on December 6, one week after the G-20, when more concrete plans could be finalized.
WTI Weekly Chart
NATURAL GAS has been relatively calm after the wild gyrations last week, which had resulted in the first weekly drop in four weeks. Anticipated warmer temperatures along the US east coast for early December have taken some of the wind out of the commodity’s surge. However, stockpiles data as at November 23 due on Thursday is expected to show a drawdown on inventories for a second week, which could support prices. Gas is currently trading at 4.205.
Precious metals
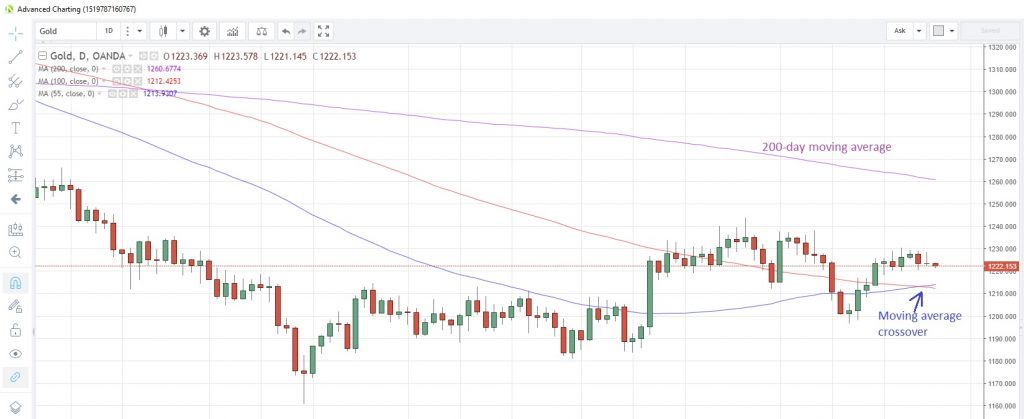
GOLD has been steady over the past week, consolidating its rise above the 100-day moving average earlier this month. Speculative accounts turned net bullish again in the week to November 20, after switching to bearish the previous week for the first time in five weeks, latest data from CFTC has shown.
Exchange traded funds (ETFs) increased their holdings of gold last week, and total holdings are currently 0.5% higher than a year ago, Bloomberg reports. Australia’s gold output in the three months to end-September was six tons higher than a year ago and, if maintained, could keep 2018 output at record levels.
Gold is now at 1,221.84 after the 55-day moving average traded above the 100-day moving average yesterday for the first time since May 14. The 200-day moving average is at 1,260.68.
Gold Daily Chart
SILVER remains capped by the 100-day moving average and is currently retreating from the two-week high struck late last week. There haven’t been many drivers for silver’s moves, and direction has mostly been determined by the US dollar’s oscillations. The gold/silver (Mint) ratio is hovering below the decade high touched earlier this month. It’s now at 85.875 with this month’s high at 86.336.
PALLADIUM’s attempt to reach the highs of the gold price has taken a breather during the last week as the metal failed to breach the 1,200 mark. Last week the precious metal hit 1,187.70, the highest since Oanda started collecting data in 2005. It has since eased off by as much as 5.8% and is now at 1,148.8. Speculative investors increased the net long positioning in the week to November 20 to 14,264 contracts, the highest since the week of March 6, according to the latest data published by CFTC.
PLATINUM has been confined to a tight range this past week, supported around the 838 level by a rising trendline drawn from the August low and capped by the 200-day moving average, currently at 870.75. Speculative accounts reduced their net long positions for a second straight week to November 20, according to the latest CFTC data snapshot released yesterday.
Platinum producer Zimbabwe has delayed a proposed tax on unprocessed platinum exports to 2022 after miners committed to build processing facilities in the country by 2024 latest. A 15% levy on unprocessed materials was introduced in 2014.
Base metals
COPPER has traded within a 2.62 to 2.85 range since mid-September and has had a tendency to edge toward the upper parameter on more occasions than the lower one. Copper’s fortunes ebb and flow depending on the progress, or lack thereof, in the US-China trade war. With the G-20 meeting looming this weekend, where the two presidents are slated to sit down at the negotiating table, hopes are rising for a deal, or at least a framework/timetable, to be agreed. Copper has tracked the 55-day moving average higher for more than a week, and is currently at 2.74.
Australian miner BHP Group has announced it has identified a potential new iron oxide, copper and gold seams in South Australia. A further drilling program is slated to commence in early 2019.
Agriculturals
WHEAT is testing resistance at the 100-day moving average of 5.056 and remains supported by the 200-day moving average at 4.925. The weather is raising concerns about this year’s harvests. Heavy rains in South Africa’s wheat belt has forced the country to trim its 2018 harvest, while Argentina has also cut its crop forecast by 1.6% to 1.87 million tons, also due to rains, though output will still be at record levels. At the other extreme, China has said that dry weather may hit crop yields.
SOYBEANS prices are hovering near the convergence of the 55- and 100-day moving averages around the 8.54 level. The commodity has fallen about 2% this week and could be heading for a second consecutive week of declines. Soybeans are now trading at 8.534.
In its latest report, the US Department of Agriculture revealed that net US soybean exports rose 45% to 684,000 tons in the week ended November 15. It’s unlikely that any of those sales were to China, because latest customs data show China’s imports of soybeans from the US slumped 95% year-on-year in October. At the same time, Brazil’s exports to China rose to 6.53 million tons, a jump of more than 90% from a year earlier.
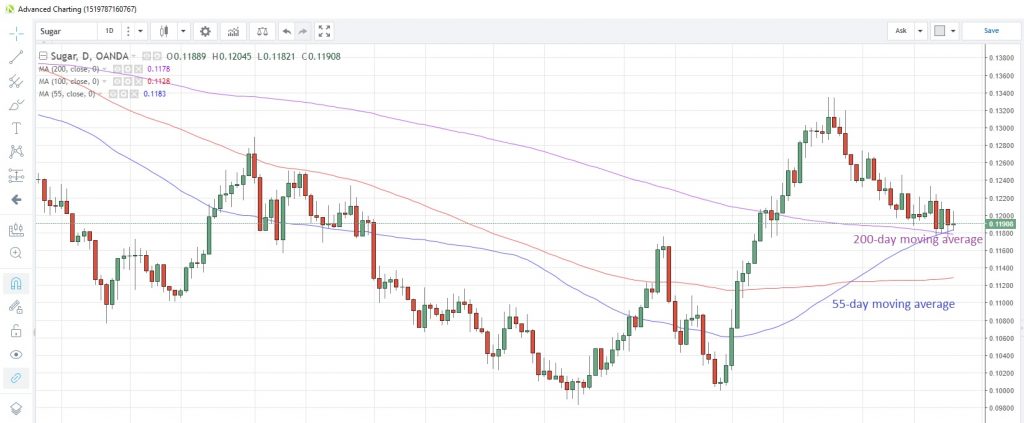
SUGAR hit a six-week low last week after posting the fifth consecutive weekly decline from the seven-month high struck in the second half of last month. The commodity is testing support at the 200-day moving average, which is at 0.1178 today. This moving average has supported prices on a closing basis since October 10.
Sugar Daily Chart
India is expected to overtake Brazil as the top global sugar producer for the first time in 16 years this year. However, Brazil is still expected to retain its number one spot as the world’s top sugar exporter. That could change though, with markets bracing for a possible glut of Indian sugar to hit international markets later this year.
CORN touched the lowest level in a month yesterday, trading below the 100-day moving average at 3.5337 for the first time since October 11. It’s now at 3.538. Brazil has increased its 2018-19 corn crop forecast by 1.2% from the previous season.
Content is for general information purposes only. It is not investment advice or a solution to buy or sell securities. Opinions are the authors; not necessarily that of OANDA Business Information & Services, Inc. or any of its affiliates, subsidiaries, officers or directors. If you would like to reproduce or redistribute any of the content found on MarketPulse, an award winning forex, commodities and global indices analysis and news site service produced by OANDA Business Information & Services, Inc., please access the RSS feed or contact us at info@marketpulse.com. Visit https://www.marketpulse.com/ to find out more about the beat of the global markets. © 2023 OANDA Business Information & Services Inc.


