A weaker US dollar on the back of a more-dovish slant to some Fed speakers’ comments has helped metals to recover, while energy markets have experienced extreme volatility. Agricultural commodities are steady to firmer.
Precious metals
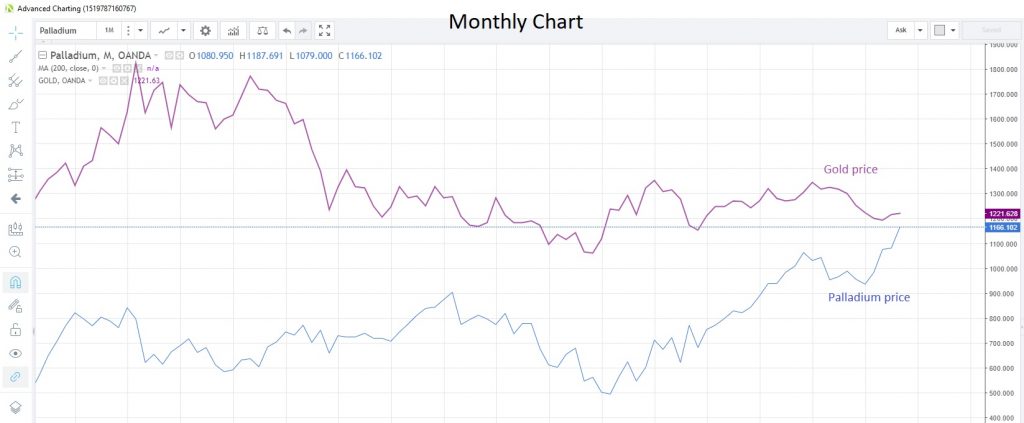
PALLADIUM scaled new highs yesterday, reaching the highest since Oanda began collecting data in 2005. The metal has risen more than 11% this year, making it the top performing metal, while the jump from the August low is a more impressive 20.7%. The metal is within striking distance of the gold price for the first time ever. The move is being driven by a combination of tight supply and anticipated rising demand from China on the back of a change in automobile emissions levels, which would require greater use of palladium in catalytic converters.
Palladium/Gold Daily Chart
Speculative long positioning is at its highest since the week of March 6, the latest data from CFTC as at November 13 shows. Bloomberg has reported that the scramble for the metal is pushing holdings in ETFs backed by palladium to the lowest since 2009.
GOLD has benefited from a bout of US dollar weakness, posting gains for the first time in three weeks last week. The metal has risen through the 1,211 – 1,214 window, which represents the 55- and 100-day moving averages, respectively, though has still yet to overcome the 200-week moving average at 1,235.25. This moving average has capped prices on a closing basis since last July.
Speculative accounts turned net bearish on gold for the first time in five weeks, according to the latest data snapshot as at November 13 released by CFTC last Friday.
SILVER is also riding the weaker US dollar bandwagon, though not quite as aggressively as gold. Silver rose the most in seven weeks last week, but failed to convincingly breach resistance at the 55-day moving average of 14.434. Futures positioning by speculative traders is at its most bearish since the week of October 9, according to the November 13 snapshot by CFTC.
The gold/silver (Mint) ratio has been steady around the 85 level so far this week after easing off from decade highs last week. The ratio is above the 55-day moving average at 84.16 and has closed above this average on a daily basis since September 28.
PLATINUM has been contained by the 55-and 200-day moving averages for the past two months. The 55-day moving average lends support at 829.77 while the 200-day average acts as resistance at 874.62, with the current rate at 852.54. Platinum fell for a second straight week last week to meet the rising trendline drawn from the August low at 827.45. Platinum is now at 853.44.
Speculative investors reduced their net long positions for the first time in three weeks as longs were scaled back from a near-eight month high.
Base metals
COPPER saw its biggest gain in eight weeks last week as hopes emerged of better discussions between the US and China on trade wars. The bullish impetus may not last through this week following an apparent souring of relations at the weekend. The industrial metal is hovering near this month’s highs, as the 55-day moving average trades above the 100-day moving average for the first time since April 3.
China’s Statistics Bureau announced last Friday that the country’s copper output in October was 3.8% higher than a year ago. Meanwhile, a Chilean government agency has trimmed its 2018 price forecast to $2.97 per pound from $3 in July due to trade war volatility. However, it still sees strong demand for copper amid shrinking stockpiles.
Energy
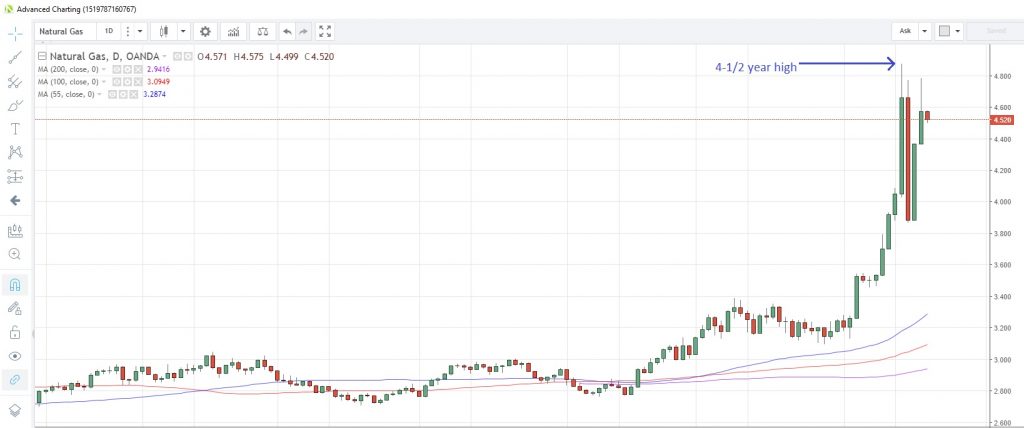
NATURAL GAS has seen very whippy markets in the last week. Last Wednesday the commodity rose a hefty 15%, the biggest gain in 14 years, to reach a 4-1/2 year high, only to slump 17% the very next day. That was the worst daily decline in 15 years. Weather forecasts and a scramble to cover unhedged short positions were reportedly behind the initial moves.
NatGas Daily Chart
CRUDE OIL has managed a four-day recovery from last week’s one-year low amid expectations of a dent in supply as Saudi Arabia is due to cut production by 500,000 barrels in December. The magnitude of the rally reached almost 6% before faltering, and WTI looks poised to drop today for the first time in five days.
Crude oil inventories are rising, a key indication of oversupply, with EIA crude stocks rising 10.3m barrels in the week to November 9, the biggest weekly increase since early-February 2017. Earlier this month, an informal OPEC meeting suggested production cuts going in to 2019, and these may be ratified, or expanded, at the next official OPEC meeting in Vienna on December 6.
Agriculturals
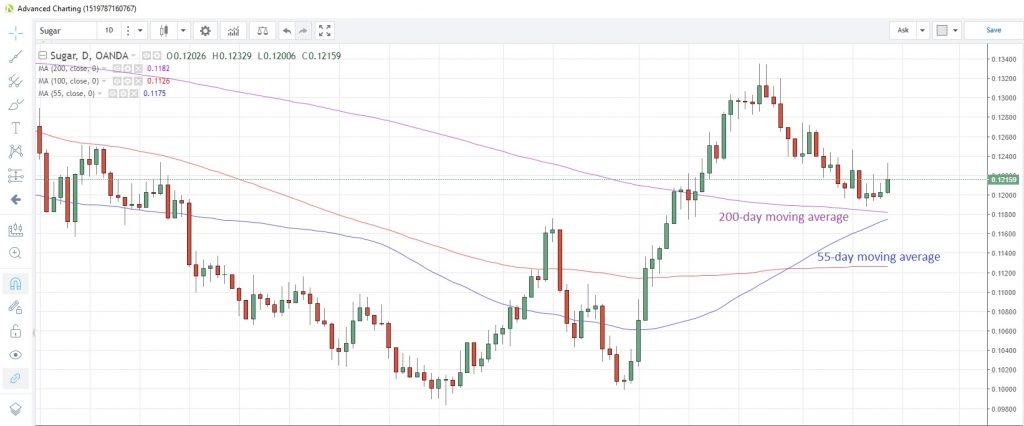
SUGAR prices are currently on the rebound from 5-1/2 week lows despite oversupply in the market, as a weaker US dollar stalls the recent slide. Sugar closed at 0.12159 yesterday after surviving a test of the 200-day moving average at 0.1182. The 55-day moving average is at 0.1175 and rising, looking set to cross above the 200-day moving average later this week.
Sugar Daily Chart
India has announced that its harvest in the season to October 1 was the biggest on record, adding to the global glut. Australia has referred India to the World Trade Organization regarding subsidies it pays to farmers, giving them an unfair competitive advantage over Australian producers.
CORN continues to hold above the 55-day moving average, as it has done on a closing basis since September 28. The moving average is at 3.551 today, while corn is now at 3.591. In the week to November 8, the US Department of Agriculture revealed that US corn exports rose more than 27% from a week earlier, from 702,000 tons to 894,000 tons.
SOYBEAN prices continue to be driven by the various better/worse developments surrounding the US-China trade wars. Prices fell the most in a month yesterday as relations appeared to sour after US VP Pence traded barbed comments with Chinese leader Xi at an APEC summit at the weekend. The decline comes despite news of some crop losses in Argentina due to heavy rains. Soybeans are now trading at 8.641 and holding above the 55-day moving average at 8.515.
WHEAT is hugging the 200-day moving average at 4.9153 and is looking to test the support for a second straight day. Pakistan has said it plans to more than double wheat export in FY2019 (to March/April), Bloomberg reports.
Content is for general information purposes only. It is not investment advice or a solution to buy or sell securities. Opinions are the authors; not necessarily that of OANDA Business Information & Services, Inc. or any of its affiliates, subsidiaries, officers or directors. If you would like to reproduce or redistribute any of the content found on MarketPulse, an award winning forex, commodities and global indices analysis and news site service produced by OANDA Business Information & Services, Inc., please access the RSS feed or contact us at info@marketpulse.com. Visit https://www.marketpulse.com/ to find out more about the beat of the global markets. © 2023 OANDA Business Information & Services Inc.


