Gold is under the cosh from the dollar’s resurgence while oil prices surge due to the usual supply concerns. Most agriculturals rose on the back of the renegotiated trade deal between the US, Mexico and Canada. Industrial metals ease lower after disappointing Chinese PMI data.
Precious metals
GOLD speculative net short positioning increased to its highest since December 2001 as prices declined for a sixth straight month in September. Accounts sold an additional 6,804 contracts in the week to September 25, according to the latest CFTC data published last Friday, bringing total net short positions to 17,648, the most since the week of December 11 2001.
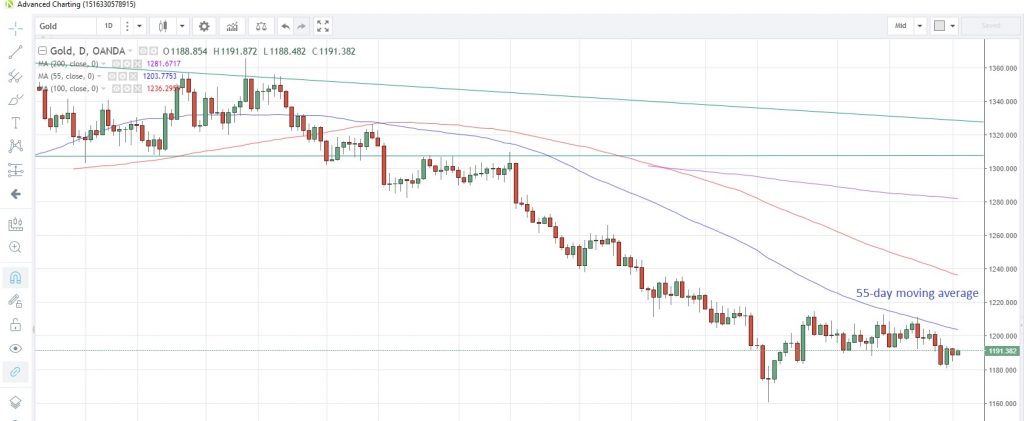
Gold’s slide came as the US dollar reasserted its bid bias after the Fed hiked rates last week and said it was on track for four more hikes before the end of 2019, given the current robust state of the US economy. Gold has been stuck in a broad 1,180-1,220 range for the past six weeks, trading entirely at the whim of the US dollar. The 55-day moving average at 1,203 remains an obstacle to the upside with support likely near the August low of 1,160. It’s now at 1,191.44.
Daily Gold Chart
Speculative accounts were not so bearish on SILVER, having reduced net short positions for a third straight week, according to the latest data as at September 25. Silver jumped to its highest level in a month last Friday, the last trading day of the third quarter. Reports suggest Silver is finding support as it is relatively cheap, inflationary expectations are rising and there is robust demand from the industrial sector.
Like gold, the 55-day moving average, at 14.76 today, remains a barrier and the metal has traded below it since June 18. The gold/silver (Mint) ratio has been in steady decline since hitting a near term peak at 85.15 on September 11, and is currently at 81.898, having bounced off the 55-day moving average at 81.363.
PALLADIUM is currently consolidating the rise to an eight-month high at the end of September. The precious metal is nearing the record high seen in January but, while speculative net long positions increased to 9,690 contracts in the week to September 25, their highest since June 19, they are well short of the 27,614 record levels seen in January. Reports also say the ETF holdings of the metal are at a nine-year low.
The metal is now trading at 1,059.30 with some support expected at the June 7 high of 1,030.52 and at the early-September highs of 990.70 and 993.30. Resistance is seen at the September 28 high of 1,095.70.
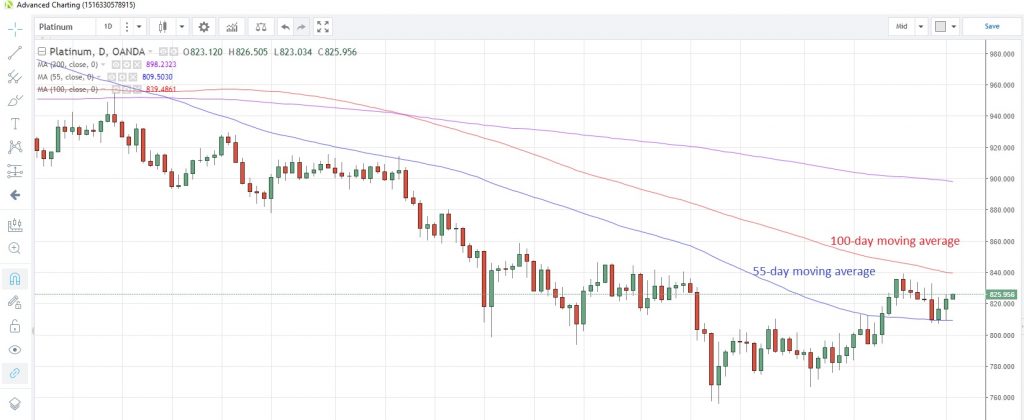
PLATINUM has been sandwiched between the 55- and 100-day moving averages for the past ten days and has struggled to garner any upward momentum recently, unlike palladium. Speculative net positioning remains long and has risen to the highest level since June 12. The metal has to overcome the 100-day moving average, at 838.73 today, to generate any significant returns for those longs. That moving average has capped prices since March 27.
Platinum Daily Chart
Base metals
COPPER prices have been on a downward track for the past two days after China released disappointing PMI data at the weekend. The manufacturing PMI slid to 50.8 in September, the lowest in seven months, and suggests the US-China trade war is starting to impact the manufacturing sector, and hence may crimp demand for the industrial metal going forward.
September had been a good month for copper, registering its first monthly gain in four months, but prices stalled ahead of the 100-day moving average, which is at 2.8376 today. Support may be found near the 55-day moving average at 2.6979. The metal is now at 2.7462.
Energy
CRUDE OIL prices jumped about 3% yesterday with West Texas Intermediate hitting its highest levels in nearly four years as WTI closed above the 100-month moving average for the first time since September 2014. There were no new catalysts to spur the surge, just the usual supply issues regarding Venezuela and Iran, though a drop in the US oil rig count might suggest lower production in the future.
US President Trump reportedly called Saudi King Salman bin Abdulaziz at the weekend to talk about high oil prices, but price action since then would suggest it fell on deaf ears. WTI touched $75.75 yesterday while Brent crude hit $86.06 as the spread widened back out to near 10 points again.
Saudi Arabia is said to plan to increase spending by 100 billion riyals ($26.7 billion) in 2019 in order to boost growth. Current forecast suggest GDP growth for this year will hit 2.1%, up from 0.9% in 2017. To fund this spending, obviously Saudi Arabia would enjoy higher oil prices and some are suggesting that they may be willing to leave a gap in the Iranian shortfall to promote firmer prices.
NATURAL GAS looks to be building up to a third straight monthly gain as it powers ahead to eight month highs. Gas is benefiting from increased demand for both cooling and heating amid above-average temperatures in the eastern US while western regions are feeling cooler temperatures. Gas hit 3.148 earlier today, the highest since February 1, and could test the 100-month moving average at 3.28 in the near term. That moving average was last tested on September 1.
Latest data from the US EIA shows the US gas exports in the first half of 2018 were more than double the 2017 average and indicated that the US was a net exporter in five of the six months. Morocco has put a Liquefied Natural Gas project worth $4.6 billion to build import terminals and supply lines up for tender. It expects to be importing up to 7.6 billion cubic meters of gas by 2025.
Agriculturals
SOYBEANS are attempting a rebound from the near 10-year lows struck last month. The commodity has managed a 6.6% gain from the 8.032 low on September 18, and is testing the 55-day moving average at 8.486. The announcement of a revamped trade deal between the US, Mexico and Canada is helping sentiment. However, given the oversupply amid a bumper crop outlook and with inventories at 11-year highs, according to the latest quarterly USDA stocks report, gains could be limited.
WHEAT snapped a four-day losing streak yesterday and is looking to consolidate the move today. Provisions in the renegotiated US, Mexico and Canada trade deal, USMCA, for US wheat growers which would allow a regrading of US wheat quality, and thereby higher prices, has helped sentiment.
Russia is attempting to woo Algeria as a potential export market. Algeria is the fourth largest wheat importer and currently gets most of its requirements from France.
The 200-day moving average continues to track prices higher and is sitting at 4.765 today. Wheat is at 4.928 now with the 55-day moving average acting as resistance at 5.128.
US CORN growers are lauding the breakthrough in the USMCA, given that Mexico is the biggest importer of US corn. There were concerns that, if negotiations had failed, Mexico would begin to source its imports elsewhere, notably Argentina. Corn saw its biggest one-day rally since June 12 yesterday, after the deal was announced. Corn is currently trading at 3.517 and is looking to test 100-day moving average resistance at 3.5646.
SUGAR’s advance after the trade deal was less aggressive, given the oversupply conditions that prevail in the market. India announced last week measures to provide assistance to sugar millers to promote exports and reduce a domestic glut. Supply was also extended as South African output was delivered to the ICE futures market for the first time since at least 2004 as quotas in the EU ended.
Sugar rose 4.1% yesterday to close at 0.1068. The 100-day moving average is at 0.1112.
Content is for general information purposes only. It is not investment advice or a solution to buy or sell securities. Opinions are the authors; not necessarily that of OANDA Business Information & Services, Inc. or any of its affiliates, subsidiaries, officers or directors. If you would like to reproduce or redistribute any of the content found on MarketPulse, an award winning forex, commodities and global indices analysis and news site service produced by OANDA Business Information & Services, Inc., please access the RSS feed or contact us at info@marketpulse.com. Visit https://www.marketpulse.com/ to find out more about the beat of the global markets. © 2023 OANDA Business Information & Services Inc.


