Trump’s displeasure at the slow progress on US-China trade negotiations and China’s reneging on earlier promises was evident as he threatened to ramp up tariffs on Chinese goods this Friday. This knocked risk appetite for six and pressured most commodities, apart from safe-haven gold.
Precious metals
GOLD is in the midst of a three-day rally which started Friday as suddenly-deteriorating trade negotiations encouraged some safe haven buying. In the week to April 30, speculative investors increased their net long positions for the first time in three weeks, according to CFTC data.
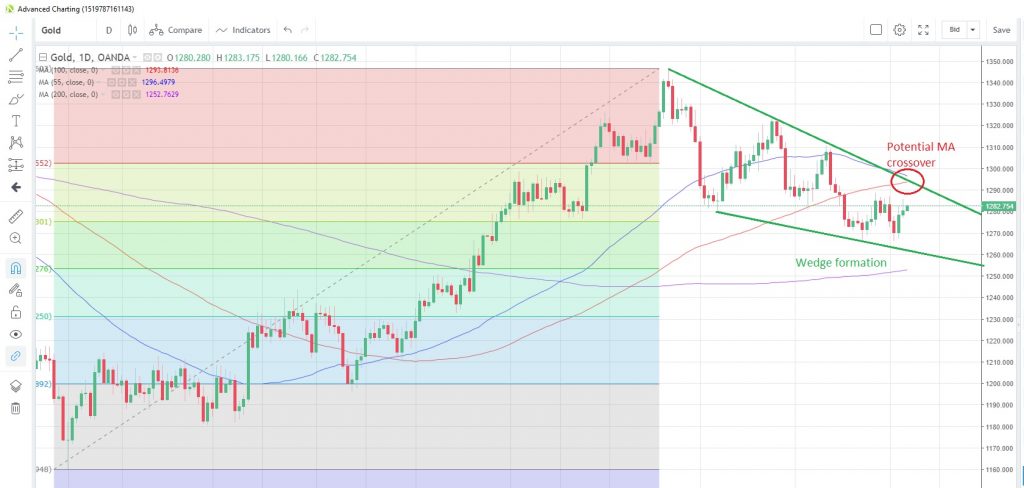
The 55-day moving average at 1,298.0 looks set to cross below the 100-day moving average at 1,293.8 later this week, which may be seen as a longer-term bearish signal. Meanwhile, the yellow metal is confined within an unfolding wedge chart formation, awaiting a breakout either way.
Gold Daily Chart
SILVER is consolidating the biggest one-day gain in almost two months made last Friday, and is sitting just below the 200-day moving average at 14.9366. Speculative investors turned net buyers for the first time in three weeks, according to CFTC data as at April 30. Bloomberg notes that Exchange-Traded Funds (ETFs) increased holdings of silver by the most since February 14 last Friday.
The gold/silver (Mint) ratio remains elevated at 85.93 and has held above the 55-day moving average since February 27.
PLATINUM is on a three-day rising streak as it rebounds from five-week lows. Reports that a South African platinum mine was forced to close for a safety inspection following an incident that trapped 1,800 miners underground raised concerns about the supply side. The price differential between platinum and palladium has narrowed to $466 from $741 in March.
Speculative investors remain bullish on the commodity, with net long positioning at its highest in 15 months, according to the latest data snapshot from CFTC.
PALLADIUM remains in consolidation mode after falling to a four-month low last week, which represented an almost 19% drop from the record high seen in March. Bullish speculative investors have not thrown in the towel just yet, adding to net long positions for a second consecutive week, according to the latest data snapshot from CFTC as at April 30.
Base metals
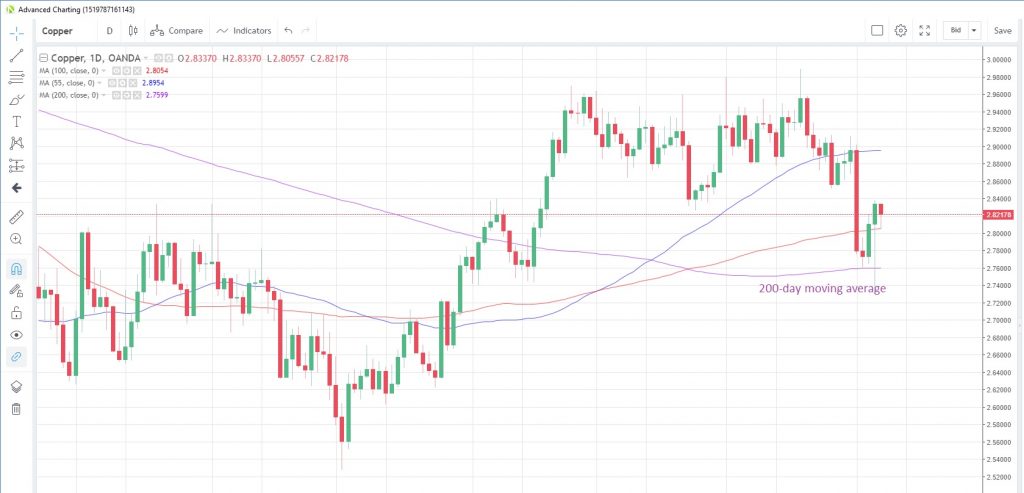
COPPER prices remain surprisingly resilient considering the negative sentiment surrounding the US-China trade negotiations this week. Prices touched the lowest since January 30 yesterday in a knee-jerk reaction to the Trump tariff threat but rebounded strongly to close in the black. The rebound ensured that prices remained above the 200-day moving average at 2.7599 on a closing basis. That moving average has supported prices since February 15.
Speculative investors turned bearish on the commodity in the week to April 30, the first time since the week of February 5, CFTC data shows.
Copper Daily Chart
Energy
NATURAL GAS prices remain subdued, hovering just above 2-1/2 year lows amid slackening demand with cooler weather across the US expected for the next week, reducing demand for gas for air-conditioning. Optimistic bulls may find some comfort in the fact that gas stockpiles are below normal levels for this time of year, though weekly EIA data has been showing that stockpiles have been building up over the past five weeks, with last week’s increase the most since June 2015.
CRUDE OIL prices have been volatile at the start of this week, under pressure initially following Trump’s tariff threat at the weekend, but recovering late in the day on news from the US Department of Defence that it would be deploying a carrier group to the Middle East as a deterrent to Iran amid alleged evidence of an escalation in activity there.
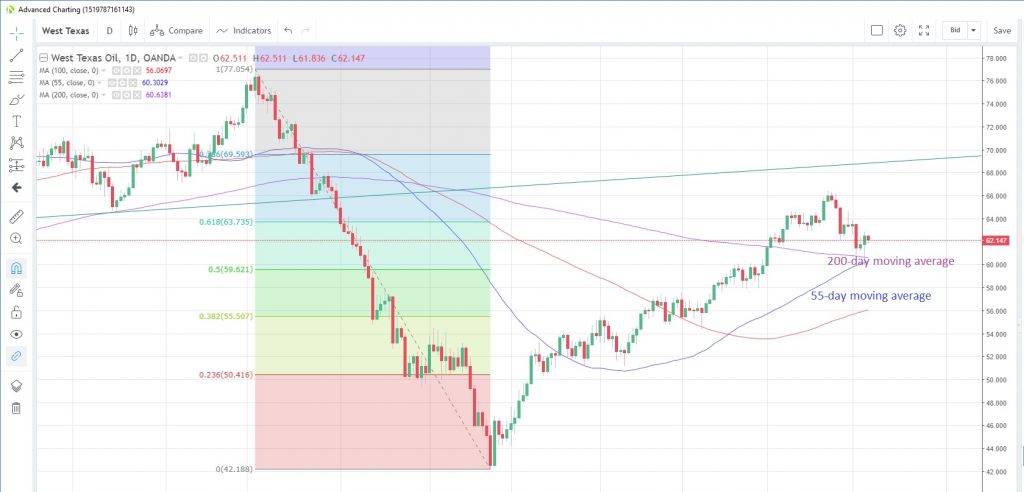
West Texas Intermediate (WTI) posted a second consecutive weekly decline last week, the first time since December. Yesterday’s down-move saw WTI trade below the 200-day moving average at $60.638 for the first time since April 2 and trade below $60 per barrel for the first time since April 1. The 55-day moving average continued to support at $60.303. Prices have closed above this moving average since January 17.
News that Saudi Arabia announced that it was cutting June pricing for all crude shipments to the US could keep the current rebound capped. It is unsure whether this was done to placate US President Trump and his comments that oil prices were too high, or for other reasons.
West Texas Intermediate Daily Chart
Agriculturals
WHEAT prices are hovering near 15-month lows amid expectations of solid supply. The Wheat Quality Council had its annual crop review and reported that crop yields across Kansas were very solid. In addition to the potential oversupply situation, Trump’s tariff threat could see an escalation in the trade war and heap additional pressure on the agricultural sector.
Speculative investors are the most bearish on wheat since January last year and increased their net short positions for a third straight week to April 30, according to the latest CFTC data.
SUGAR prices closed at the lowest level in four months on Friday after India announced that its output for the season just ended on April 30 rose to 33 million tons, up from 32.5 million tons the previous season, and the highest on record. Prices have now fallen for two consecutive weeks and speculative investors turned net bearish on the commodity for the first time in seven weeks to April 30, the latest data from CFTC shows. Markets were closed yesterday due to a UK bank holiday.
News that wet weather across the US Midwest may delay the CORN planting schedule could not help corn prices at the start of this week. Prices look set to fall for a second straight day today after failing to overcome the 200-day moving average at 3.594. The moving average has capped prices on a closing basis since April 4. Speculative investors are heavily bearish, having been net sellers for the past five weeks and boosting bearish bets to the highest since March 1996.
SOYBEANS look set for a fifth weekly loss this week, matching the longest stretch seen last May-June. Prices touched a more than decade low yesterday following Trump’s weekend tweet, given that soybeans were the first commodity to be hit when the trade wars began. Speculative investors appear to expect further losses as net short positioning has reached its highest since September 1997.
Content is for general information purposes only. It is not investment advice or a solution to buy or sell securities. Opinions are the authors; not necessarily that of OANDA Business Information & Services, Inc. or any of its affiliates, subsidiaries, officers or directors. If you would like to reproduce or redistribute any of the content found on MarketPulse, an award winning forex, commodities and global indices analysis and news site service produced by OANDA Business Information & Services, Inc., please access the RSS feed or contact us at info@marketpulse.com. Visit https://www.marketpulse.com/ to find out more about the beat of the global markets. © 2023 OANDA Business Information & Services Inc.


