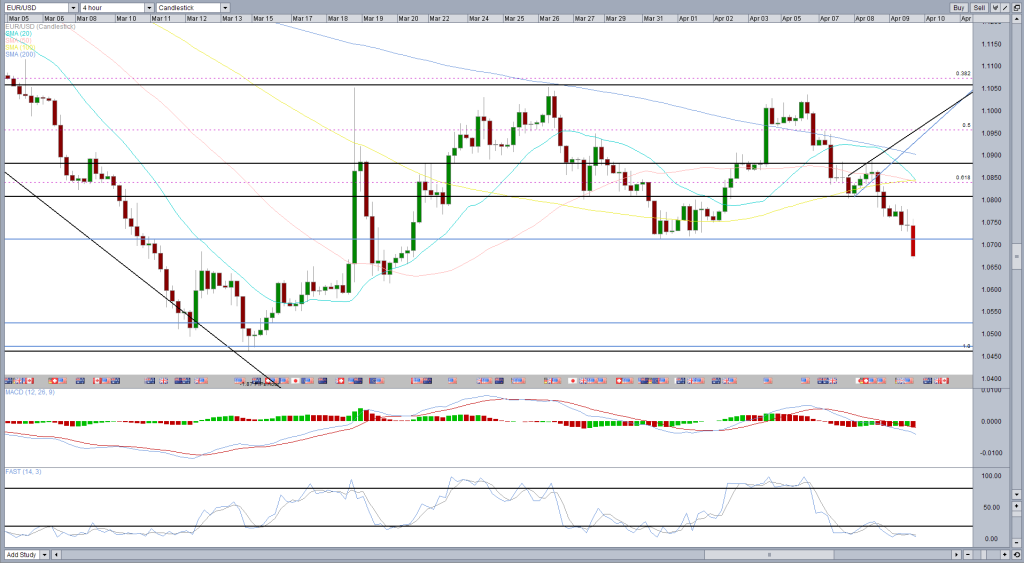
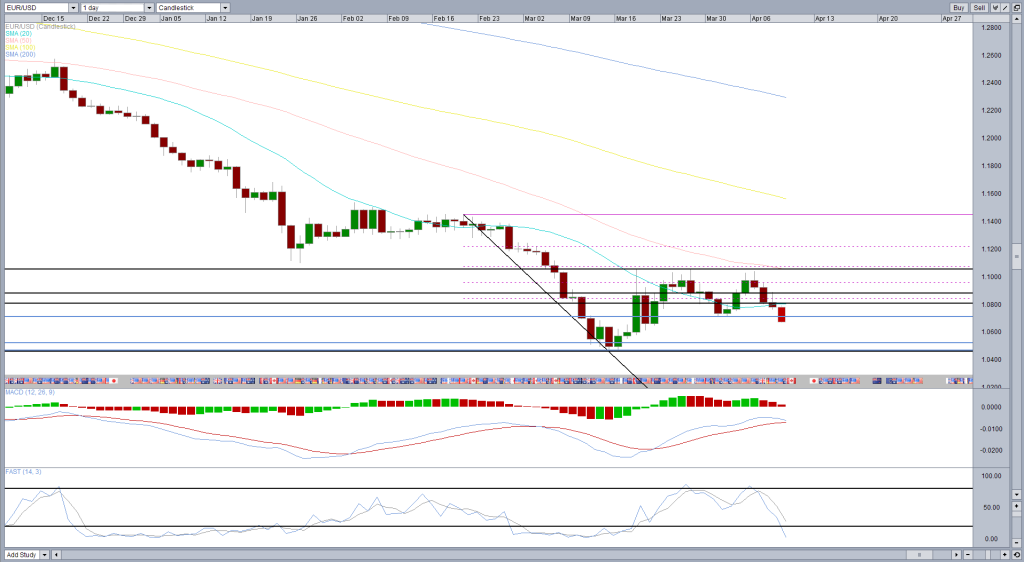
The euro appears to have been trading within a range against the dollar for around a month now, with the downside coming around 104.50 and the upside around 1.1050. Within this range, the pair has been contained within a smaller block – 1.07 to 1.1050 – for much of that period.
During that time, a double top has formed in the pair and the neckline of that – 1.07 – has been broken today. One of the best things about spotting formations like double tops is that when the neckline is broken, not only does it suggest that momentum is gaining to the downside, it also gives us a potential downside target.
This is calculated by taking the size of the formation – in this case 318 pips – and taking it away from the neckline level – 107.13 – which gives us a potential target of 103.95. Of course, there is never a guarantee that this level will be hit, it is just a general rule for double top formations.
You will notice on the 4-hour chart that the stochastic is currently very overbought and has been for most of the last two days but as of yet we are yet to see a divergence with price action and therefore this doesn’t concern me. Especially as the MACD suggests momentum is now gaining to the downside once again. Any divergence would act as a red flag that a reversal could occur.
You will notice that 103.95 is below the low seen on 13 March, which is the lowest that the pair has traded at since January 2003. With that in mind, the pair is likely to face significant support at the 104.62 lows. It is worth noting that when using double top targets, as with all technical analysis, it is always worth combining them with other support levels as it can only increase the chance of price finding support here. In this case, a divergence around the previous lows may suggest that price is going to continue to trade within that range.
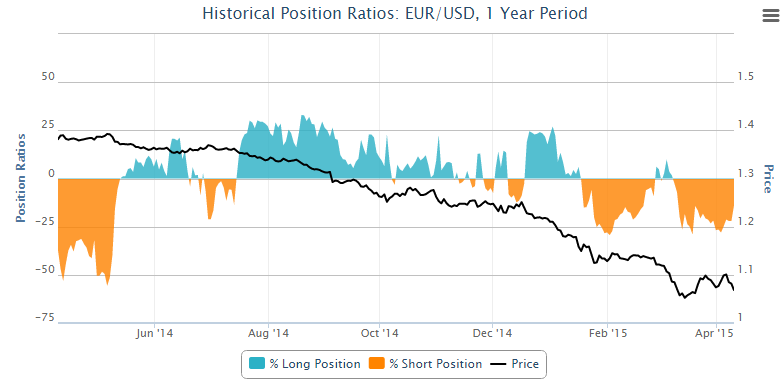
The open positions ratio tool – that can be found in our FX Labs – shows that our clients net position is on the right side of this trade, with 57.04% of them short. That said, that may not necessarily be a bad sign.
The historical position ration – which can also be found in FX Labs – shows that this is not uncommon. The pair has often declined at a time when clients net position is becoming increasingly long or less short. If anything, this could be a good sign that further declines in the pair are likely.
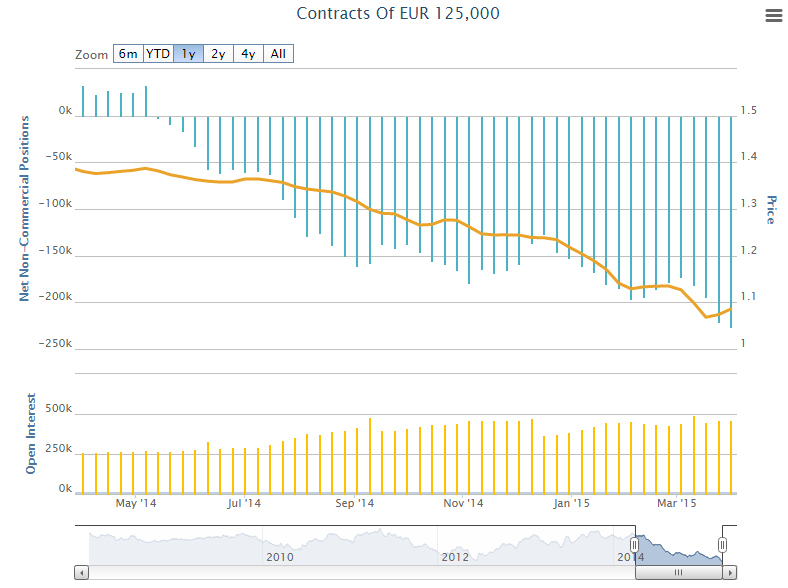
Add to all of this the fact that according to the Commitment of Traders (COT) report, which is issued weekly by the Commodity Futures Trading Commission (CFTC), non-commercial traders are becoming increasingly bearish the euro at a time when open interest is high and I find it very difficult to be anything other than bearish right now.
The net non-commercial positions from the COT report can be found in FX Labs along with many other analysis tools.
Content is for general information purposes only. It is not investment advice or a solution to buy or sell securities. Opinions are the authors; not necessarily that of OANDA Business Information & Services, Inc. or any of its affiliates, subsidiaries, officers or directors. If you would like to reproduce or redistribute any of the content found on MarketPulse, an award winning forex, commodities and global indices analysis and news site service produced by OANDA Business Information & Services, Inc., please access the RSS feed or contact us at info@marketpulse.com. Visit https://www.marketpulse.com/ to find out more about the beat of the global markets. © 2023 OANDA Business Information & Services Inc.


