Big jump in new China cases
Yesterday’s data suggested that the spread of the coronavirus had slowed dramatically, with just 300 new cases reported in China, according to data from Johns Hopkins University. As at yesterday, the number of cases in mainland China was approximately 44,700, an increase of just 400 from the previous day.
However, this morning, the total of cases has jumped to about 59,700 with total cases worldwide reaching 60,200. It is still unclear whether the jump is due to a revision of prior data or a fresh upsurge. The increase came as provincial officials adopted a new methodology for counting infections, which will now include those clinic-diagnosed cases, although it was not immediately clear to what extent the new methods affected the results.
The big jump has taken some of the fire out of the risk rally which saw US indices hit incremental record highs yesterday. US indices have retreated between 0.30% and 0.38%, with the US30 index under-performing. Safe havens came back into favour, with the Japanese yen rising 0.16% versus the US dollar, while 10-year US Treasury yields slid about 3 bps. Gold rose 0.42% to 1,572.70.
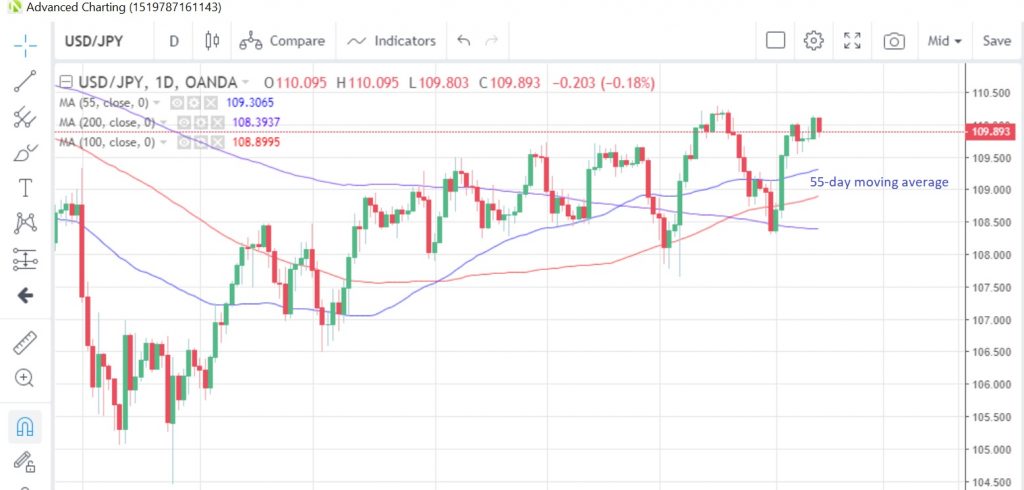
USD/JPY retreated from three-week highs, with the next technical support likely to be the 55-day moving average at 109.31. Prices have traded above that average since February 4.
USD/JPY Daily Chart
UK house prices soar
UK house prices surged in January amid renewed optimism following the UK’s breakaway from Europe, according to an index from the Royal Institute of Chartered Surveyors. The index surged to +17 from -2 in December, the biggest jump in nearly three years, as the Brexit uncertainty was removed. The growth was driven mostly by a turnaround in London and the Southeast, according to the report.
Combined with the better-than-expected Q4 economic growth numbers released on Tuesday and improved PMI data for January from last week (manufacturing PMI hit 50.0, the highest since April 2019), the UK seems to be enjoying life outside of the EU, at least for now.
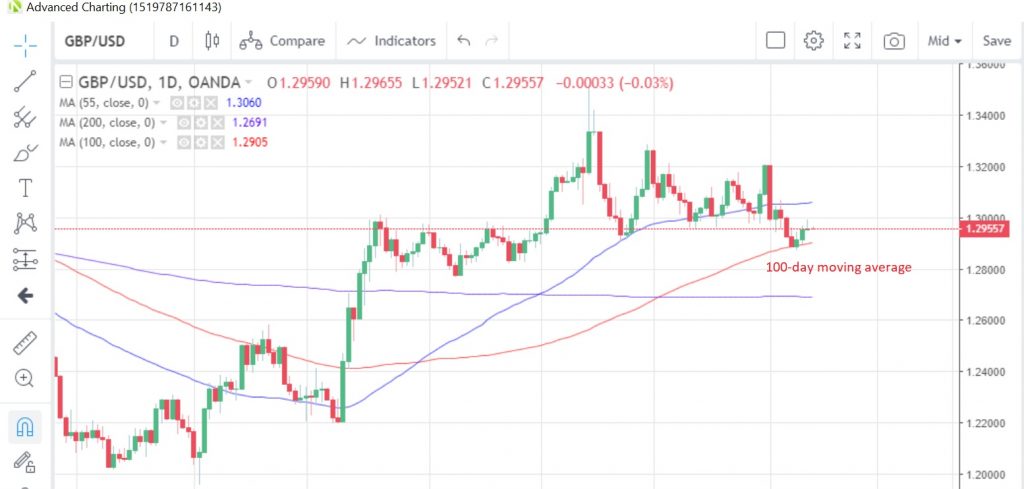
The pound has been trading with a firmer bias this week, gaining for three consecutive days and is unchanged during this morning’s Asian session. The last time this happened was in the second half of January. GBP/USD touched a week high of 1.2992 yesterday and appears to be building a base above the 100-day moving average, which is at 1.2905 today. That moving average has supported prices on a closing basis since October 10.
GBP/USD Daily Chart
Inflation data on tap
We have two sets of inflation data on the calendar today, the final German numbers for January and also those from the US. The preliminary readings for Germany were -0.6% m/m and +1.7% y/y, while US consumer prices probably rose 0.2% m/m (unchanged from December) and gained 2.4% y/y (mild acceleration from December’s +2.3%), according to the latest survey of economists. There is also a speech from ECB’s Panetta scheduled for today.
The full MarketPulse data calendar can be viewed at https://www.marketpulse.com/economic-events/
Content is for general information purposes only. It is not investment advice or a solution to buy or sell securities. Opinions are the authors; not necessarily that of OANDA Business Information & Services, Inc. or any of its affiliates, subsidiaries, officers or directors. If you would like to reproduce or redistribute any of the content found on MarketPulse, an award winning forex, commodities and global indices analysis and news site service produced by OANDA Business Information & Services, Inc., please access the RSS feed or contact us at info@marketpulse.com. Visit https://www.marketpulse.com/ to find out more about the beat of the global markets. © 2023 OANDA Business Information & Services Inc.


