US stocks traded marginally lower yesterday with S&P 500 shaving 0.20%, Dow Jones Industrial Average even lesser by 0.03%, while the perennial risk sensitive Nasdaq 100 dropped 0.44%, more than the other 2 major index combined. The reasons for the decline appears to be simple – ADP employment for the month of Jan came in at 175K vs 185K expected, while the previous month’s figure has also been revised lower to 227K. Considering that Tuesday’s rally was fragile to begin with, it is no surprise that Stock prices closed lower yesterday.
Except that wasn’t an accurate description of events.
Hourly Chart
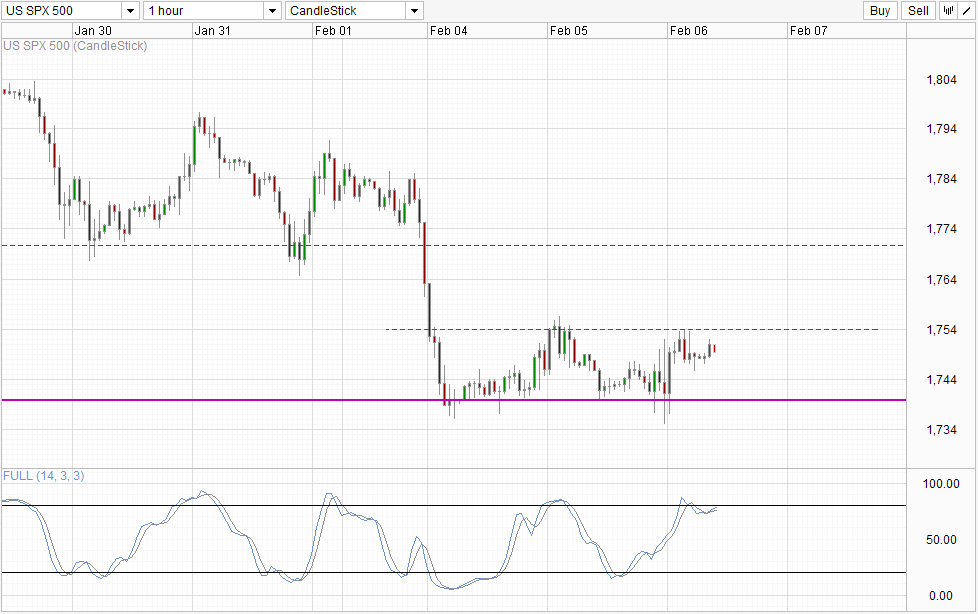
Looking at Futures prices, it should be noted that prices have already given up Tuesday’s gains during yesterday’s Asian session. From an open to close perspective, US stocks actually climbed higher yesterday. Certainly the weaker than expected ADP numbers did send prices lower, but 1,740 managed held firm in the end, and we close above the soft resistance/support level of 1,746. Hence, for all the talks about market being bearish, actual price action doesn’t concur with that assertion.
Then again, one will be hard-pressed to call current market as bullish even though the ability to rebuff the ADP numbers usually would have meant that underlying sentiment is bullish. This is because yesterday’s peak is still below the Tuesday’s peak, suggesting that the so called bullishness is not really that strong either. Hence, a more comfortable description may be that price is simply consolidating sideways bouncing between 1,740 – 1,754 – 1,755.
With Asian markets trading broadly higher today, it is interesting to see that S&P 500 futures isn’t getting any of the bullish action. This is yet another point to the sideways trend consolidation assertion which increases the likelihood of a push towards 1,740 floor. Stochastic readings are currently pointing higher after a fresh bearish signal but the signal remains valid. Should Stoch curve rebound from the 80.0 level, the likelihood of a bearish move increases but traders may preferably wish to seek further confirmation (e.g. Stoch below 72.0).
Daily Chart
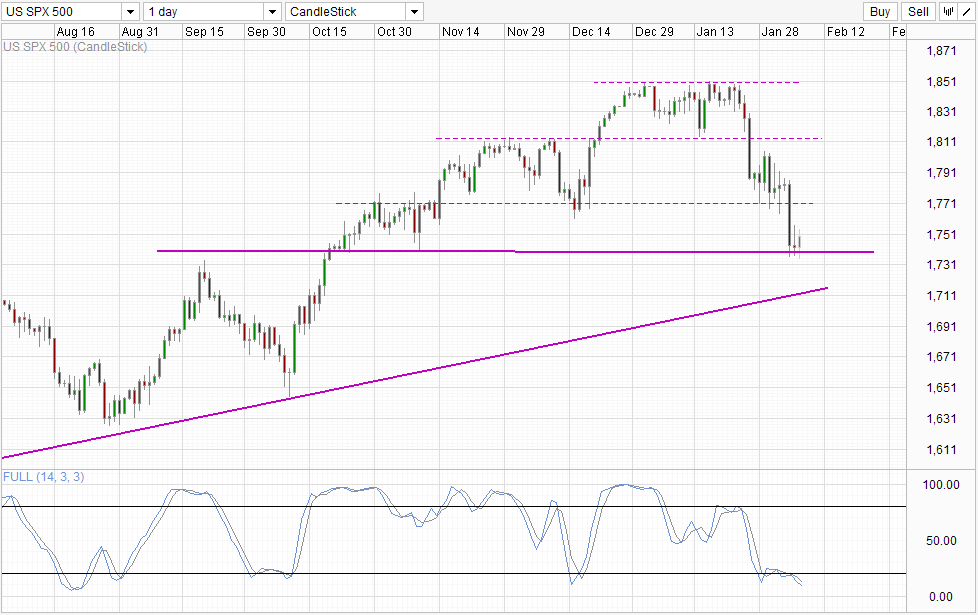
Daily Chart is slightly more bullish as a confirmation of 1,740 holding will open up a move back towards 1,770, which Stochastic indicator agrees as readings deeply oversold right now and a full bullish cycle should be able to reach 1,770 before hitting Oversold once again. However, the latest bullish candle hardly constitute a Morning Star bullish reversal pattern. What would be should be a candle that is at least half the length of the long red candle, but instead what we have now looks more like a small minor bullish pullback rather than a full reversal. This doesn’t mean that price cannot continue to climb eventually, just that we do not have good evidence of strong bullish momentum and hence the Short-Term sideways analysis remain intact.
Fundamentally, with US Non-Farm Payroll coming up tomorrow, we could see lesser traders willing to take risk (risk appetite is low right now, hence the lower stock prices) and commit in either direction ahead of the news. This lend even more strength to the sideways trend – something that could actually benefit this longer-term bearish momentum that started in Jan as this would allow bears to rest while at the same time draw the rising trendline up closer, giving us a higher likelihood of both a 1,740 and rising trendline break to draw out even stronger sell-off in the future.
More Links:
AUD/USD – Maintains Breaks Through 0.89
EUR/USD – Runs into Resistance around 1.3550
GBP/USD – Continues to Find Support at 1.6250
This article is for general information purposes only. It is not investment advice or a solution to buy or sell securities. Opinions are the authors; not necessarily that of OANDA Corporation or any of its affiliates, subsidiaries, officers or directors. Leveraged trading is high risk and not suitable for all. You could lose all of your deposited funds.


