US stocks slid lower on Monday with S&P 500 shed 0.49%, while Dow Jones Industrial Average fell 0.16% and Nasdaq 100 was the biggest loser at -0.98%. It may be easy to simply associate yesterday’s decline as a continuation of Friday’s fall, but price action does not corroborate on this assertion as prices were actually trading slightly higher during Asian and early European session. It is important to note that this rally came in spite of weaker than expected Chinese Manufacturing PMI and Germany Manufacturing PMI, suggesting that US stocks traders are actually relatively bullish in order to ignore the fundamental bearish pressure.
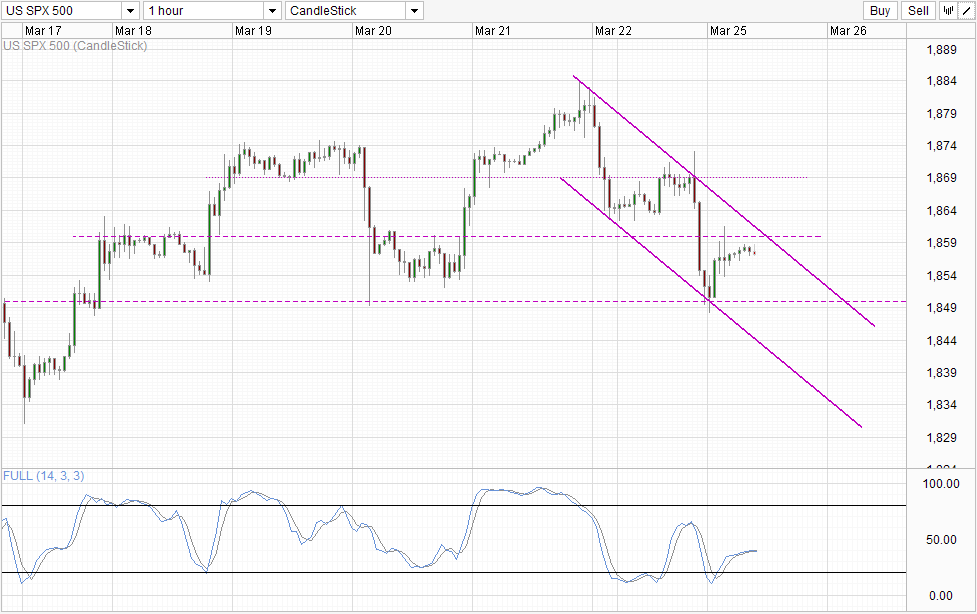
Instead, yesterday’s decline is the fault of weaker than expected US PMI (preliminary) numbers and that alone, and this is evident by the fact that stock prices actually pushed higher initially on open and only started to decline after the release of the US economic numbers, pushing S&P 500 down to 1,850 in quick fashion only to see prices starting to rebound back higher once again post New York noon.
Hourly Chart
The question we need to ask is why the sharp sensitivity to the US economic numbers? Firstly, the Markit US PMI numbers isn’t really that bearish even though it was below the expected 56.6. Latest data stood at 55.5, which is a healthy distance away from the 50.0 par and the 3rd largest print in 2 years – losing out only to last month’s number and Jan 2013. Certainly a bearish case could be made due to this disappointment, but the degree of which is excessive especially since market was broadly bullish before that.
Therefore, there is a hint of overreaction by traders, and hence it is not surprising to see prices rebounding up from the 1,850 significant support. However, whether this overreaction seen yesterday is a one-off or suggest that underlying sentiment is bearish needs to be evaluated. There is a third possibility as well – US traders are being more bearish than Asian and European counterparts. And if that is true, we should be able to see prices holding flat for the next few hours even though risk sentiment in Asia is currently bearish while European stocks are also expected to open lower as well. Should prices fall back to 1,850 during US hours without promoting later, this assertion will be confirmed. However, if this is indeed the case, then bearish follow-through may be limited in the short-run as global traders may go against the bearish flow. As such, a break of 1,850 is not guaranteed.
Daily Chart
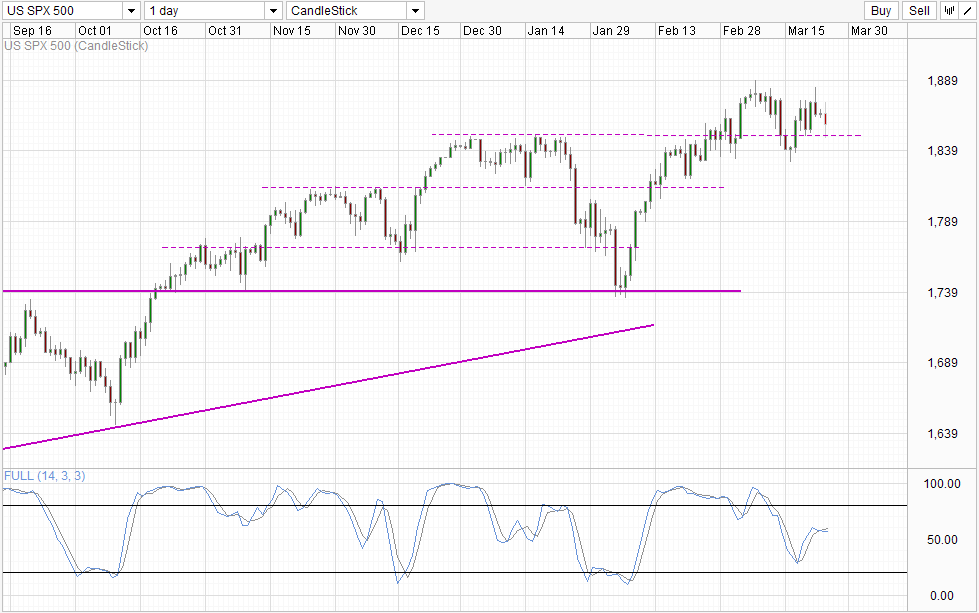
Looking at Daily Chart, it is easily understandable why the rest of the traders are not sharing the same bearishness as the US counterparts (if US traders are even bearish to begin with). Momentum is strongly bullish, and even if 1,850 is broken, it is likely that prices will find support from the 1,812.5 – 1,850 consolidation, and a break of 1,740 may be needed to fully invalidate the bullish trend. Then again, even if it does happen, the standard definition of a bear market is 20% shave off recent highs. In this case here, price will need to hit close to 1,500 for that to happen, representing more than 300 points decline.
Fundamentally, it is not difficult to argue that stock prices are overbought, as average price/earning ratios have hit above pre-crisis levels, while growth potential is definitely not as high as before. With major central banks looking most hawkish in recent years, the case for higher stock prices becomes even weaker.
More Links:
GBP/USD – Little Activity Ahead of UK Inflation Numbers
USD/CAD – Loonie Starts Week At Multi-Year Lows
AUD/USD – Improving Aussie Pushes Above 91
This article is for general information purposes only. It is not investment advice or a solution to buy or sell securities. Opinions are the authors; not necessarily that of OANDA Corporation or any of its affiliates, subsidiaries, officers or directors. Leveraged trading is high risk and not suitable for all. You could lose all of your deposited funds.


