All round good news for stocks yesterday. S&P 500 gained 0.60% while Dow Jones Industrial Average climbed 0.58%. Nasdaq 100 was the slowest of the pack, gaining only 0.52% even though it should theoretically be gaining the most when market risk appetite is bullish.
Perhaps the lagging Nasdaq 100 is telling us something? The explanation for the bullish appetite has been attributed to Markit’s flash US Manufacturing PMI numbers which came in at the highest in almost 4 years, allaying fears that the US recovery narrative is falling apart. However, it should be noted that this was the only bullish news amidst other bearish numbers. Initial Jobless Claims came in at 336K, higher than the 334K expected while Continuing Claims fared worst, growing to 2981K vs expectations of 2975K and worst than the previous week’s 2944K. Philadelphia Fed (Philly Fed Index) surprisingly shrank as well, printing -6.3 for the month of Feb versus expectations of 8.0 and 9.4 previous. Hence, it is strange that market actually ascribed an overall bullish sentiment when data is mixed at best. Also, it should be noted that Tech stocks enjoyed a relatively good day as Facebook share prices jumped back 1 day after announcing the $16 Billion ($19 Billion if you include shares not yet vested) purchase of Whatsapp, propelling most other tech stocks higher. This makes Nasdaq 100 being the weakest index yesterday even more suspicious, suggesting that risk appetite may not be as strong as what we think.
Hourly Chart
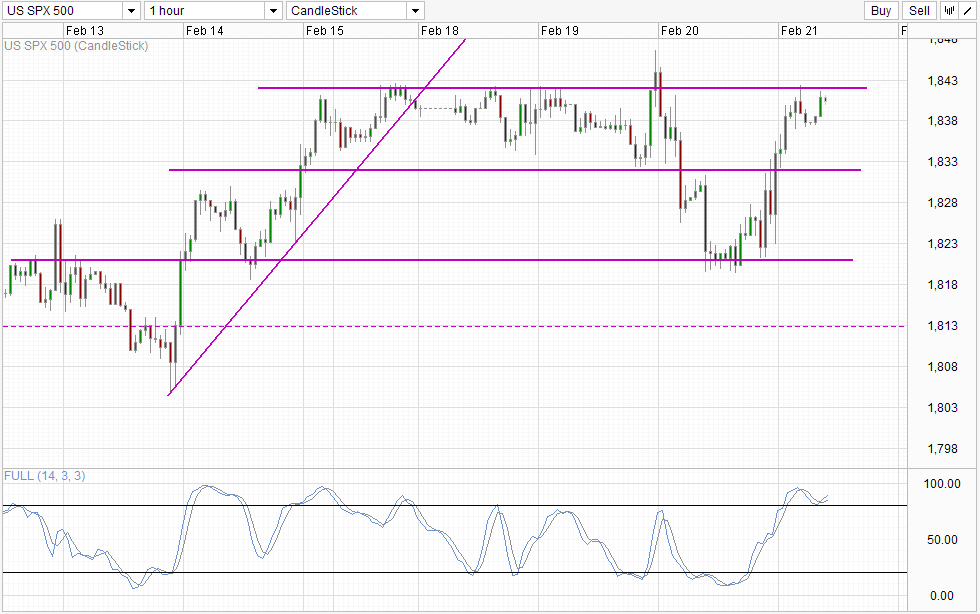
So why is S&P 500 and Dow Jones Industrial Average rising? Individual earnings of component stocks may play a part, but this charge applies more to DJI compared to S&P 500 which gives a much broader representation of the US stock market and hence individual stock gain/loss has a smaller impact. Looking at price action, it seems that the reason for yesterday’s rally may simply just be your bread and butter technicals at play.
Prices failed to break 1,821 support even though we had a 7 month low HSBC/Markit China Manufacturing PMI released during early Asia morning, suggesting that bulls are resilient. The strength of bulls of S&P 500 can also be seen when we look at European counterparts during early European hours where major indexes traded lower or flat at best during the period but S&P 500 has already started to climb up higher. This add strengths to the assertion that S&P 500 is rallying on technical bullish rebound.
That being said, bulls aren’t totally weak either. Close analysis of price action showed that prices initially failed to break the 1,832 resistance, but managed to conquer it on the 2nd try. Hence, even though we’ve failed to break 1,842 resistance just a couple of hours before, do not be surprised if current bullish momentum will be able to take us further once again.
Daily Chart
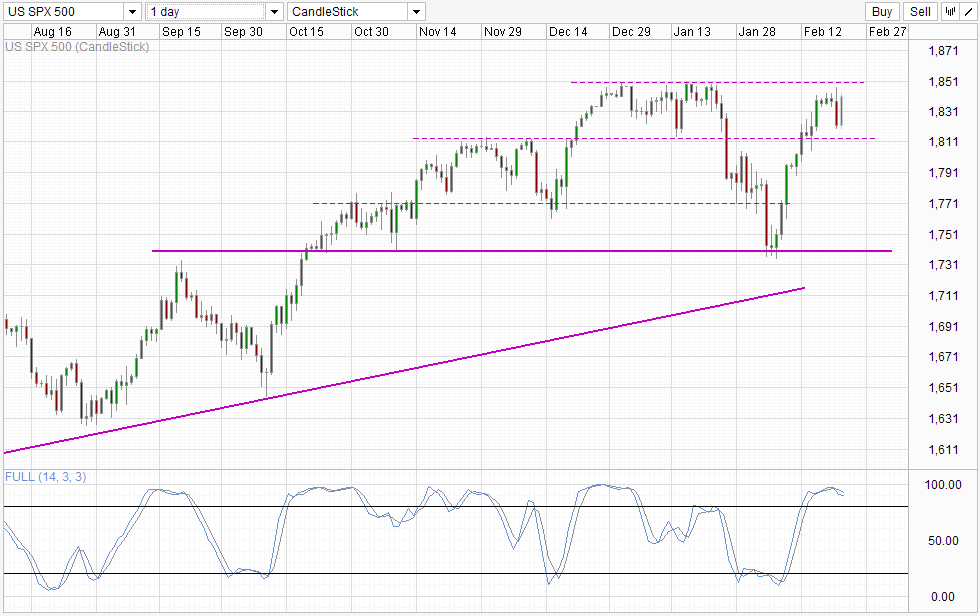
On the Daily Chart, current bullish engulfing marubozu candle is the best possible technical response to the bearish top pattern formed after Wednesday. As price has yet to properly test 1,850, the invalidation of the bearish reversal opens the door for a 1,850 push once again. However, the ability to break above 1,850 and push higher in the long-run may be difficult as current bullish momentum from early Feb has yet to suffer any significant bearish pullback (Wednesday decline doesn’t count as we’ve failed to break the 1,812.5 support). Furthermore, fundamental reasons for continued gains in stocks are weak, increasing the chance of strong pullbacks in the future even though sentiment is bullish for now.
More Links:
GBP/USD – Steady As UK Manufacturing Data Improves
USD/CAD – Greenback Settles Down After Strong Gains
AUD/USD – Under Pressure As Chinese Manufacturing PMI Slides
This article is for general information purposes only. It is not investment advice or a solution to buy or sell securities. Opinions are the authors; not necessarily that of OANDA Corporation or any of its affiliates, subsidiaries, officers or directors. Leveraged trading is high risk and not suitable for all. You could lose all of your deposited funds.


