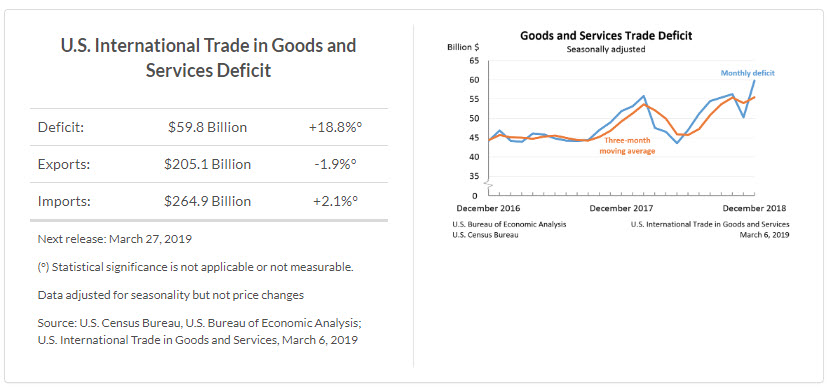
The U.S. Census Bureau and the U.S. Bureau of Economic Analysis announced today that the goods and services deficit was $59.8 billion in December, up $9.5 billion from $50.3 billion in November, revised.
Exports, Imports, and Balance (exhibit 1)
December exports were $205.1 billion, $3.9 billion less than November exports. December imports were $264.9 billion, $5.5 billion more than November imports.
The December increase in the goods and services deficit reflected an increase in the goods deficit of $9.0 billion to $81.5 billion and a decrease in the services surplus of $0.5 billion to $21.8 billion.
For 2018, the goods and services deficit increased $68.8 billion, or 12.5 percent, from 2017. Exports increased $148.9 billion or 6.3 percent. Imports increased $217.7 billion or 7.5 percent.
Three-Month Moving Averages (exhibit 2)
The average goods and services deficit increased $1.5 billion to $55.5 billion for the three months ending in December.
- Average exports decreased $1.8 billion to $208.2 billion in December.
- Average imports decreased $0.4 billion to $263.7 billion in December.
Year-over-year, the average goods and services deficit increased $6.2 billion from the three months ending in December 2017.
- Average exports increased $6.2 billion from December 2017.
- Average imports increased $12.4 billion from December 2017.
Exports (exhibits 3, 6, and 7)
Exports of goods decreased $3.9 billion to $135.6 billion in December.
Exports of goods on a Census basis decreased $3.7 billion.
- Industrial supplies and materials decreased $2.1 billion.
- Other petroleum products decreased $0.9 billion.
- Crude oil decreased $0.5 billion.
- Fuel oil decreased $0.4 billion.
- Capital goods decreased $1.7 billion.
- Civilian aircraft decreased $1.0 billion.
Net balance of payments adjustments decreased $0.2 billion.
Exports of services decreased less than $0.1 billion to $69.5 billion in December.
- Transport decreased $0.2 billion.
- Financial services increased $0.1 billion.
Imports (exhibits 4, 6, and 8)
Imports of goods increased $5.1 billion to $217.2 billion in December.
Imports of goods on a Census basis increased $5.2 billion.
- Capital goods increased $2.7 billion.
- Computer accessories increased $0.7 billion.
- Computers increased $0.7 billion.
- Consumer goods increased $2.4 billion.
- Household and kitchen appliances increased $0.7 billion.
- Cell phones and other household goods increased $0.6 billion.
Net balance of payments adjustments decreased $0.2 billion.
Imports of services increased $0.5 billion to $47.7 billion in December.
- Transport increased $0.4 billion.
Real Goods in 2012 Dollars – Census Basis (exhibit 11)
The real goods deficit increased $10.0 billion to $91.6 billion in December.
- Real exports of goods decreased $2.2 billion to $146.8 billion.
- Real imports of goods increased $7.9 billion to $238.4 billion.
Revisions
In addition to revisions to source data for the November statistics, October imports of electric energy, a component of industrial supplies and materials, were revised to incorporate a $0.2 billion correction to source data. Also, the seasonally adjusted goods data were revised for January through November so that the totals of the seasonally adjusted months equal the annual totals.
Revisions to November exports
- Exports of goods were revised down $0.8 billion.
- Exports of services were revised down less than $0.1 billion.
Revisions to November imports
- Imports of goods were revised up $0.2 billion.
- Imports of services were revised up less than $0.1 billion.
Goods by Selected Countries and Areas: Monthly – Census Basis (exhibit 19)
The December figures show surpluses, in billions of dollars, with South and Central America ($3.5), Hong Kong ($2.2), Brazil ($0.8), United Kingdom ($0.6), and Singapore ($0.4). Deficits were recorded, in billions of dollars, with China ($38.7), European Union ($15.8), Mexico ($8.8), Germany ($5.7), Japan ($5.5), Italy ($3.0), South Korea ($1.7), Taiwan ($1.6), France ($1.5), India ($1.4), OPEC ($1.3), Saudi Arabia ($1.2), and Canada ($0.7).
- The deficit with China increased $3.2 billion to $38.7 billion in December. Exports increased $0.4 billion to $7.7 billion and imports increased $3.6 billion to $46.4 billion.
- The deficit with Mexico increased $2.1 billion to $8.8 billion in December. Exports decreased $1.3 billion to $21.1 billion and imports increased $0.8 billion to $29.9 billion.
- The deficit with India decreased $0.4 billion to $1.4 billion in December. Exports increased $0.6 billion to $3.3 billion and imports increased $0.3 billion to $4.7 billion.
Annual Summary for 2018
Exports, Imports, and Balance (exhibit 1)
For 2018, the goods and services deficit was $621.0 billion, up $68.8 billion from $552.3 billion in 2017. Exports were $2,500.0 billion in 2018, up $148.9 billion from 2017. Imports were $3,121.0 billion, up $217.7 billion from 2017.
Content is for general information purposes only. It is not investment advice or a solution to buy or sell securities. Opinions are the authors; not necessarily that of OANDA Business Information & Services, Inc. or any of its affiliates, subsidiaries, officers or directors. If you would like to reproduce or redistribute any of the content found on MarketPulse, an award winning forex, commodities and global indices analysis and news site service produced by OANDA Business Information & Services, Inc., please access the RSS feed or contact us at info@marketpulse.com. Visit https://www.marketpulse.com/ to find out more about the beat of the global markets. © 2023 OANDA Business Information & Services Inc.


