A Trump-pump, or a Trump-slump? The USD/JPY may be the key indicator.
I won’t dwell too much on President Trump’s State of the Nation speech tomorrow morning Asia time. It will be covered ad-nauseam by the rest of the world. Suffice to say that the Trump reflation-ista’s, are pinning much hope on tomorrow’s speech to be laden with fiscal goodies, giving new impetus to the rather tired looking Trumpflation trade and waning USD strength. Some concrete detail will be needed on this I suspect if the long USD fatigue is not to become a coma.
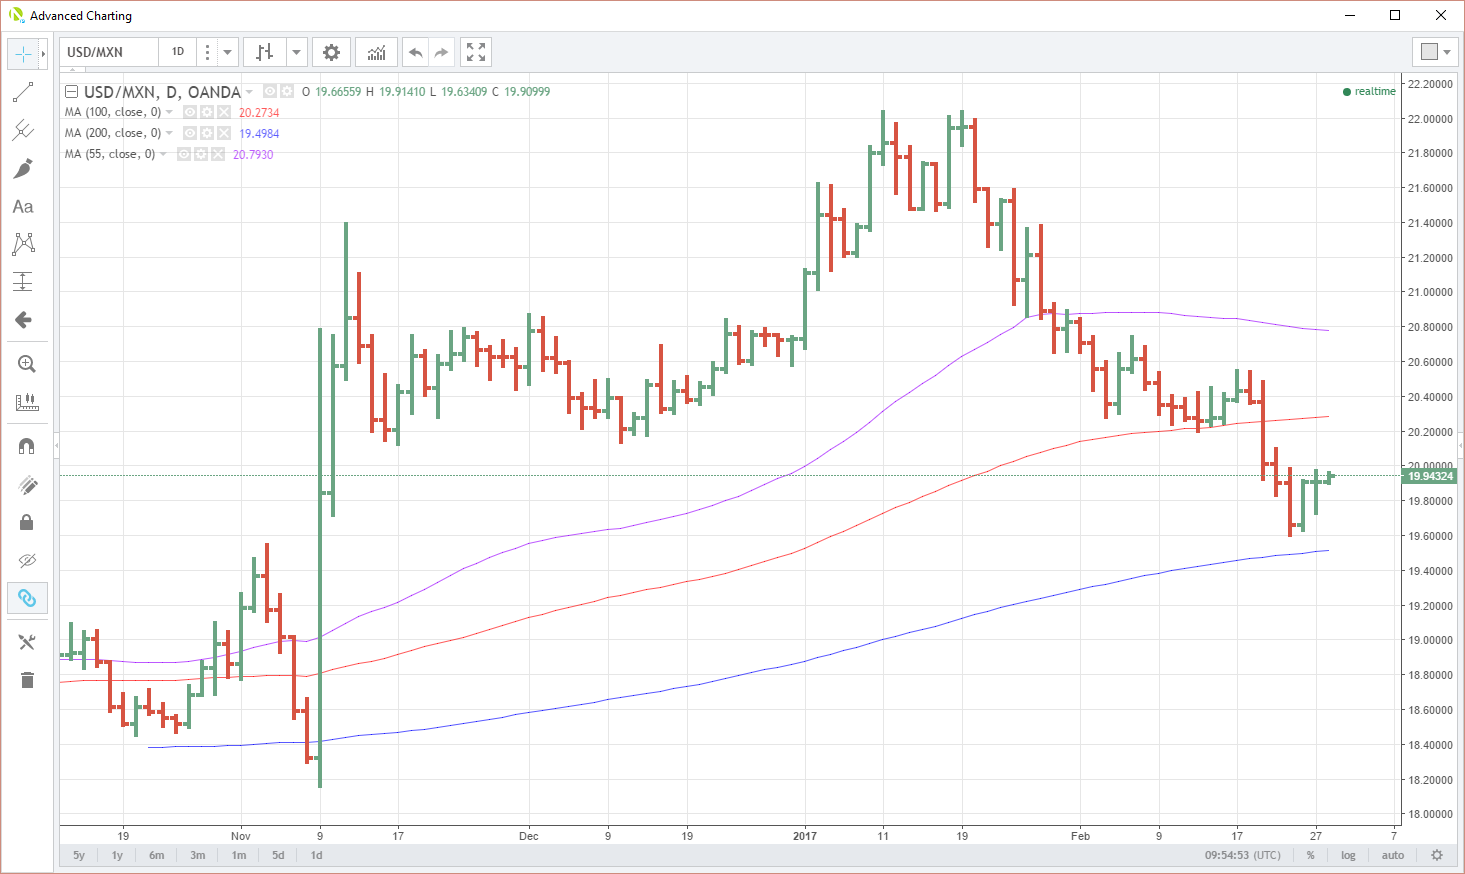
As evidence to back this up, I present to you the USD/MXN. Perhaps the most unloved of the new administration’s trading partners and unsurprisingly, the brunt of much of the USD rallies hard love; the Mexican Peso initially collapsed from 18.2000 to 21.4000 post the Trump election. After touching lows around 22.0000 to the dollar in mid-January, the Peso has since rallied back to highs of 19.6000 recouping much of its sell-off.
The chart below illustrates this and perhaps sends a signal that there is clear Trump-fatigue vis-a-vis the strong USD trade. This is not a chart showing a strong dollar. The Federal Reserve may well be needed to put the move back on track if Trump doesn’t, via a series of promised rate hikes this year. Although I am in this camp, it may be a case of once (or many) times bitten twice shy for much of the market when it comes to promised Fed rate hikes.
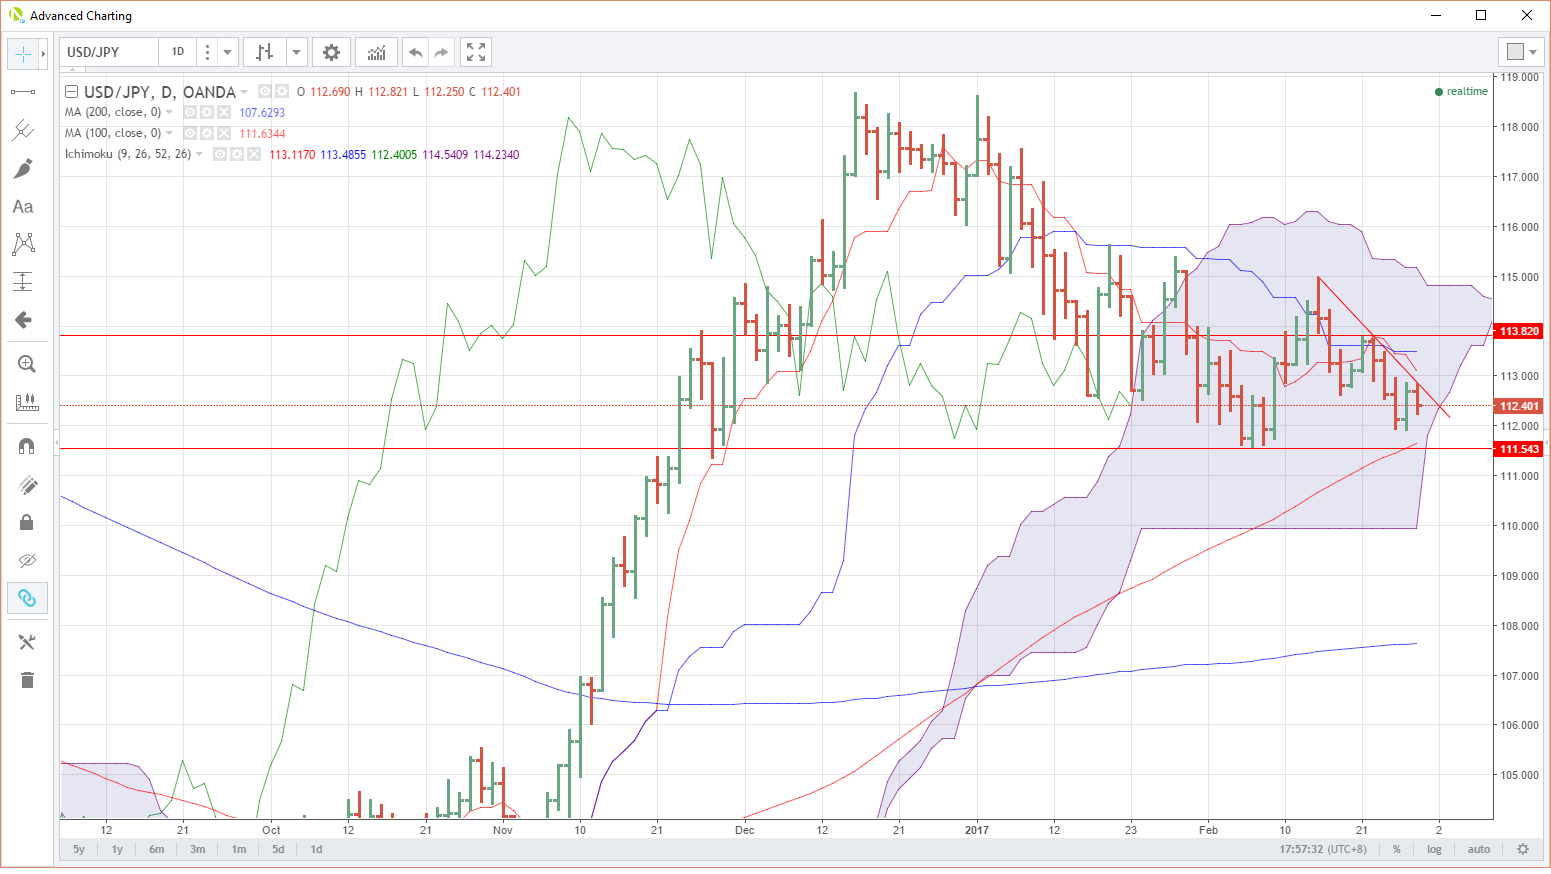
Perhaps the first signal something is seriously wrong though may come from USD/JPY tomorrow morning Asia time. The USD/JPY also ran out of steam mid-January. In a bearish technical signal, it slipped into the daily Ichimoku cloud in the last days of that month. It has remained firmly anchored there ever since.
From a technical perspective, USD/JPY has resistance at yesterday’s highs at 113.12 and also a daily resistance downtrend. Above there we have a double top noted at 113.82. The top of the cloud is far away at 115.00.
The downside on the chart looks potentially more interesting. Yesterday lows are a double bottom at 111.90. This is followed by the February low at 111.54 which is also about where the 100-day moving average is sitting today at 111.63. This 111.54/63 area is therefore somewhat crucial support.
A break of this level from a technical perspective opens up a move to the bottom of the cloud at around 110.00.
Of course one can never rule out a surprise from the Trump camp. And even if he is detail light, you can expect his attitude to be militant. However, as the charts above imply, there is a fair bit of USD long fatigue around. A speech that isn’t wonderfully tremendous could see USD bulls heading for the exit for now.
Content is for general information purposes only. It is not investment advice or a solution to buy or sell securities. Opinions are the authors; not necessarily that of OANDA Business Information & Services, Inc. or any of its affiliates, subsidiaries, officers or directors. If you would like to reproduce or redistribute any of the content found on MarketPulse, an award winning forex, commodities and global indices analysis and news site service produced by OANDA Business Information & Services, Inc., please access the RSS feed or contact us at info@marketpulse.com. Visit https://www.marketpulse.com/ to find out more about the beat of the global markets. © 2023 OANDA Business Information & Services Inc.


