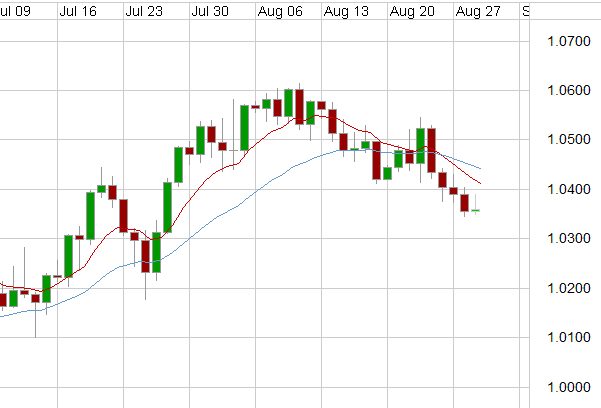
Having enjoyed a solid run up since the beginning of June, The AUD / USD is starting to show signs of tiring and easing off considerably. Throughout this period, its retracements have been in the order of approximately 2 cents however the present sell off has moved a little further. The break through the 1.04 level was the telling blow as it is now meeting reasonable resistance there. (Daily chart below)

AUD/USD |
Aug 29 at 04:45 GMT |
| 1.0358/59 | H: 1.0389 | L: 1.03496 |
| S3 | S2 | S1 | R1 | R2 | R3 |
| 1.0350 | 1.0300 | 1.0200 | 1.0400 | 1.0550 | 1.0600 |
AUD/USD Technical
- During the hours of the Asian trading session on Wednesday, the AUD / USD has eased off a little from its earlier highs towards 1.0390.
- Short term, the 1.0350 level is likely to offer some support and the 1.0300 level is likely to offer support beyond that.
- Current range: Staying below 1.0400. Is the AUD / USD ride over?
Further levels in both directions:
- Below: 1.0350, 1.0300, and 1.0200.
- Above: 1.0400, 1.0550 and 1.0600.
August 29
- AU 1:30 (GMT) Construction Work Done (Q2)
- CA 12:30 (GMT) Industrial product price index (Jul)
- CA 12:30 (GMT) Raw Materials Price Index (Jul)
- US 12:30 (GMT) Core PCE Price Index (Prelim.) (Q2)
- US 12:30 (GMT) GDP Annualised (Prelim.) (Q2)
- US 14:00 (GMT) Pending Home Sales (Jul)
Content is for general information purposes only. It is not investment advice or a solution to buy or sell securities. Opinions are the authors; not necessarily that of OANDA Business Information & Services, Inc. or any of its affiliates, subsidiaries, officers or directors. If you would like to reproduce or redistribute any of the content found on MarketPulse, an award winning forex, commodities and global indices analysis and news site service produced by OANDA Business Information & Services, Inc., please access the RSS feed or contact us at info@marketpulse.com. Visit https://www.marketpulse.com/ to find out more about the beat of the global markets. © 2023 OANDA Business Information & Services Inc.

