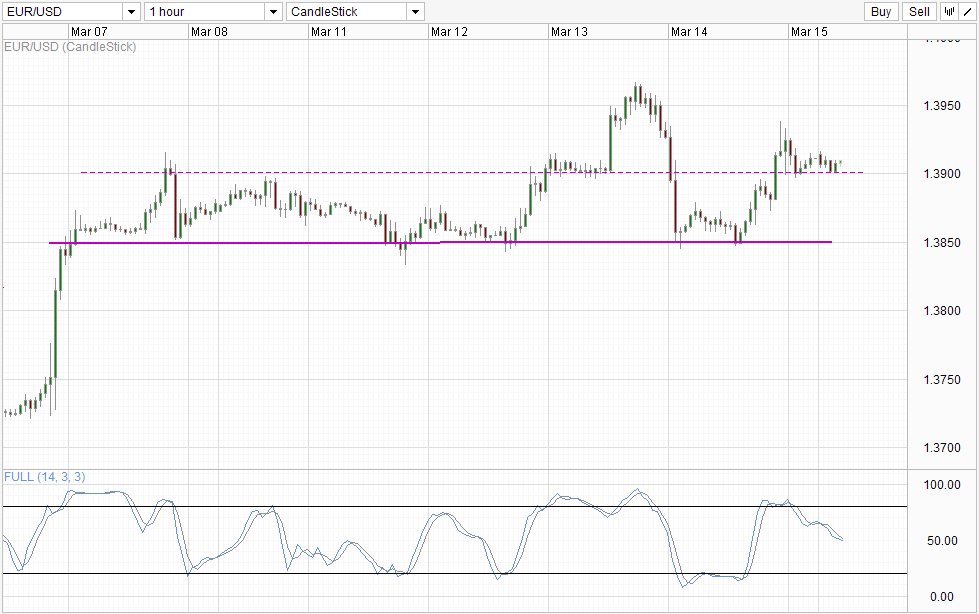
EUR/USD strayed lower this morning but was mostly stable above 1.39 round figure. By keeping above the key level, the rally of last Friday remained intact and bullish pressure continue to favor a push towards Thursday’s high. However, before we get all excited about the bullish prospect of EUR/USD, it is important to understand why prices even rallied to begin with.
Looking at the economic calendar on Friday, we can see that economic numbers from Euro zone have exceeded or at the very least met expectations. Germany consumer price index came in as expected, while Employment numbers from the Euro zone has improved on a Q/Q basis. Y/Y wise we are still seeing slight decline, but the -0.5% is certainly slower than the -0.8% figure seen the previous quarter. Across the English Channel UK’s economy appears to be slightly better as well with Construction Output growing 5.4% Y/Y after seasonal adjustments, stronger than expected 5.2% and higher than previous month’s 4.9%. All these numbers echoed the broad recovery narrative of the Euro Zone, pushing EUR/USD higher.
Hourly Chart
However, astute readers will notice that price action does not really line up with the economic news announcements. EUR/USD was already recovering before European markets opened, and actually traded slightly lower when the Euro Zone employment numbers were released. Prices climbed up once again during early US session where US stocks were bearish, a move that is peculiar when we consider that USD should be strengthening during the same period due to safe haven flows. This assertion seemed to be accurate when we see that Gold prices actually climbed higher during the aforementioned period, while USD/JPY traded lower as well, suggesting that traditional risk off flows were alive and well and hence USD should also be strengthening broadly too.
Therefore, the fact that EUR/USD managed to climb higher is a sign that underlying sentiment of EUR/USD is bullish. This is once again affirmed by the holding of 1.39 support when Asian market is less than bullish. Stochastic indicator suggest that prices is within a bearish cycle right now, but we could also see Stochastic curve rebounding off the 50.0 “support” level, lending strength to 1.39 support holding.
Daily Chart
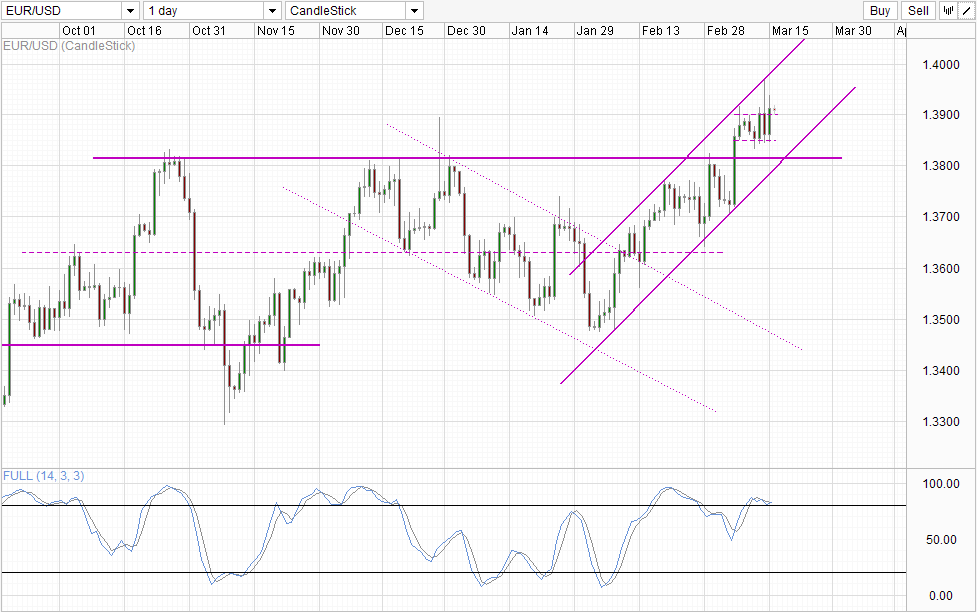
Daily Chart is less optimistic though as prices may be in the midst of a bearish rejection from Channel Top, which would open up a move back towards Channel Bottom. Stochastic indicator on the Daily Chart also leans towards a bearish cycle but Stoch curve should preferably push below 65.0 to signal stronger bearish conviction. This is important as a bullish breakout may be in play with 1.39 support holding, which opens the possibility of a more throughout test of Channel Top. As such, more confirmation is needed in order to invalidate the breakout and at the same time establish strong/longer-term bearish momentum.
More Links:
USD/JPY – Yen Rally Continues As Markets Fret Over Ukraine
Week in FX Europe – Euro Shrugs Off Ukraine and Draghi’s Comments
Gold Technicals – Paring Early Gains As Market Calm After Crimean Vote
This article is for general information purposes only. It is not investment advice or a solution to buy or sell securities. Opinions are the authors; not necessarily that of OANDA Corporation or any of its affiliates, subsidiaries, officers or directors. Leveraged trading is high risk and not suitable for all. You could lose all of your deposited funds.


