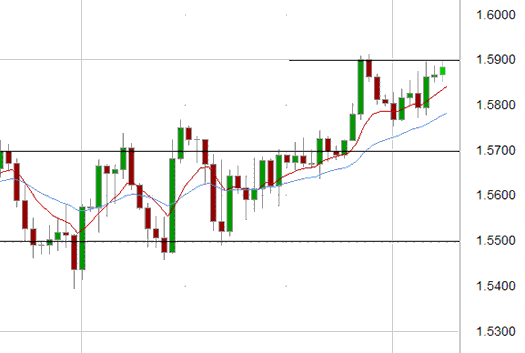
At the same the Euro completed its ascending triangle pattern and broke through the resistance level at 1.24, the Cable has been able to finally break through and stay above the medium term resistance level at 1.57. It ran into a brick wall in the form of excessive selling at 1.59 but has recovered well in the last week to return to 1.59. This level has reinforced itself as one of significance and one that continues to loom large.
Having recently broken through the medium term resistance level at 1.57, the GBP/USD has done well to maintain its price comfortably above this level. This level is now likely to become a support level although over the short term, the 1.5750 to 1.58 area appears to be holding it up well as it presently pushes towards and places pressure on the sellers at 1.59. (Daily chart below)

GBP/USD |
Sep 3 at 23:00 GMT |
| 1.5885/86 | Â Â H: 1.5898 | Â Â L: 1.5853 |
| S3 | S2 | S1 | R1 | R2 | R3 |
| 1.5800 | 1.5700 | 1.5500 | 1.5900 | 1.6000 | — |
GBP/USD Technical
- During the early hours of the Asian trading session on Tuesday, the GBP/USD has been quiet and trading within a narror range between 1.5880 and 1.5900.
- Short term, the 1.58 level has been offering some support and the 1.57 is likely to offer support over the medium term having previously been a strong resistance level for several months.
- Current range: Maintaining above 1.5700 and in the short term, sitting comfortably above 1.58. With the support expected at 1.57, will the cable begin a push back up towards 1.60?
Further levels in both directions:
- Below: 1.5800, 1.5700, and 1.55.
- Above: 1.5900 and 1.6000.
- Should the GBP/ USD be able to maintain its price above the present significant level at 1.5700 and continue to pressure the sellers at 1.59, then a return back to 1.60 is possible.
September 4
- AU 1:30 (GMT) Net Exports of GDP (Q2)
- AU 4:30 (GMT) RBA Overnight Rate (Sep)
- US 12:58 (GMT) Manufacturing PMI (Aug)
- US 14:00 (GMT) Construction Spending (Jul)
- US 21:00 (GMT) Vehicle Sales (Aug)
Content is for general information purposes only. It is not investment advice or a solution to buy or sell securities. Opinions are the authors; not necessarily that of OANDA Business Information & Services, Inc. or any of its affiliates, subsidiaries, officers or directors. If you would like to reproduce or redistribute any of the content found on MarketPulse, an award winning forex, commodities and global indices analysis and news site service produced by OANDA Business Information & Services, Inc., please access the RSS feed or contact us at info@marketpulse.com. Visit https://www.marketpulse.com/ to find out more about the beat of the global markets. © 2023 OANDA Business Information & Services Inc.

