Hourly Chart
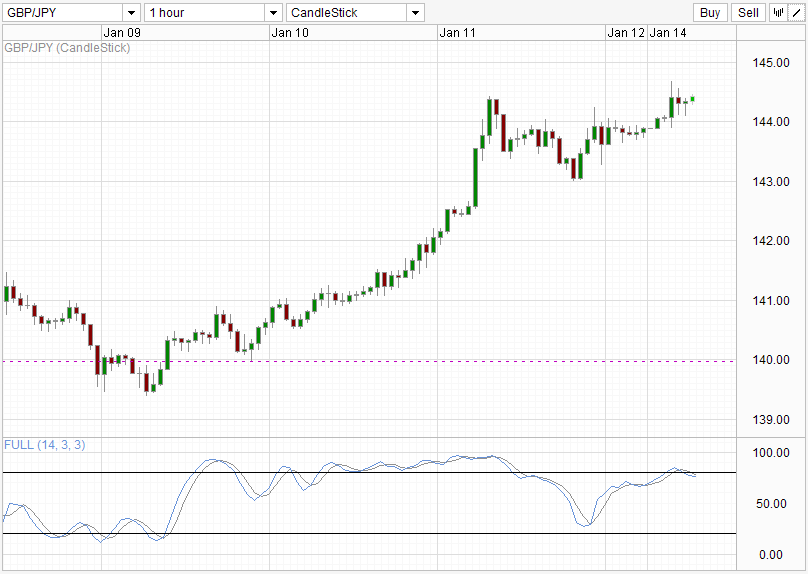
GBP/JPY started this week early with a new high. Honestly though, the idea of a new 12-month high is losing its significance when every currency trading against the yen is strengthening with 12 month highs being posted everywhere including CHF/JPY. GBP/JPY is on an uptrend that we know, questions we should be asking should therefore be thus – Is the uptrend going to continue indefinitely? Is this a good price to enter Long if I haven’t already done so?
The first part of the question is certainly false. Nothing is going to climb indefinitely; pullbacks should always be expected. The issue with pullbacks is that we can never be sure what the magnitude of the pullback can be, or how long the pullback can last especially when the trend is going strong. Hence the maxim of most traders – trade with the trend – which leads us to the next part of the question: Is this a good price to enter?
Knowing that pullbacks are inevitable even within a strong uptrend, it will be prudent to identify potential pullbacks so that traders may be able to take opportunity of better prices – adding more pips to your trades. Looking at hourly chart, Stochastics is hinting at a slowing down of bullish momentum with readings dipping below 80.0. This in itself is not a confirmation of pullback, but nicely alert us to look out for confirmations. Watch out for the highs forged on 11th Jan, and see if price is able to maintain current price, or fall back to trading range between 143 – 144.
The most bullish scenario would be price maintaining current levels above 144, and preferably above the previous swing highs. The nature of Stochastic indicator is that readings may fall back into “Oversold” region despite price maintaining same levels. With price hitting “Oversold” whilst maintaining levels above resistance, coupled with the fact that we’re in a strong bull trend, gives us confidence that price will have lower likelihood of heading south, at least that would be what the 1 hourly chart is telling us.
Weekly Chart
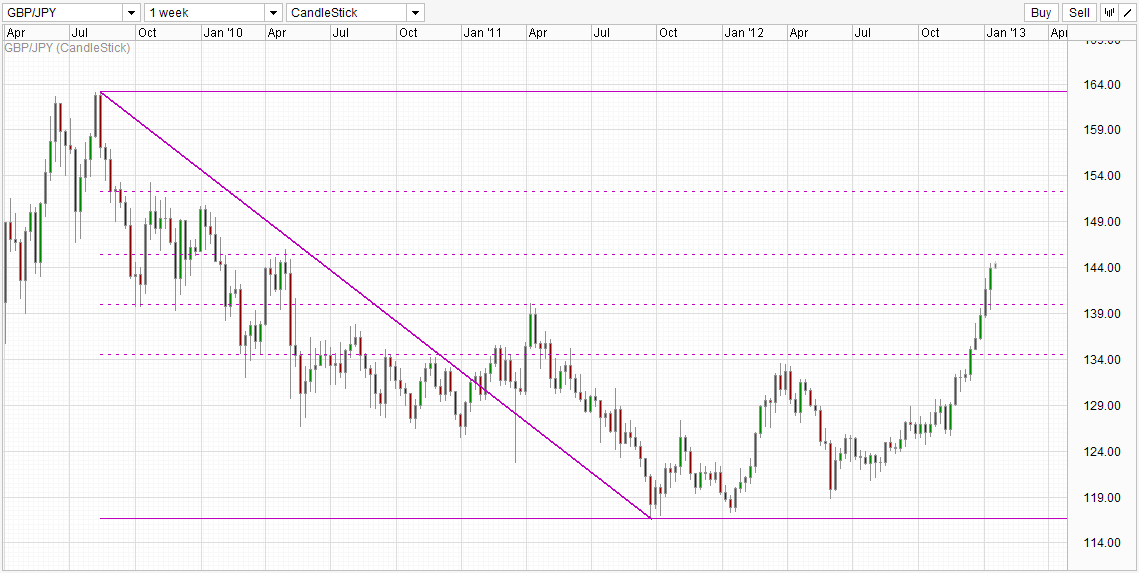
From the weekly chart perspective, we can see some overhead resistance in the form of 61.8% Fib retracement. The Fib ratios from Aug ’09 highs vs Sep ’11 lows mark out all the turning points of current weekly chart. Though current price has burst through 50% retracement easily, 61.8% could prove to be a harder nut to crack.
This article is for general information purposes only. It is not investment advice or a solution to buy or sell securities. Opinions are the authors; not necessarily that of OANDA Corporation or any of its affiliates, subsidiaries, officers or directors. Leveraged trading is high risk and not suitable for all. You could lose all of your deposited funds.
Latest posts by marketpulsefxstaff (see all)
- Oil Remains Near Multi-Month Lows - 6 August 2015
- U.S. Dollar Higher on Recent Data - 6 August 2015
- Greece’s PM Tsipras: Loan Deal with Lenders Close - 6 August 2015