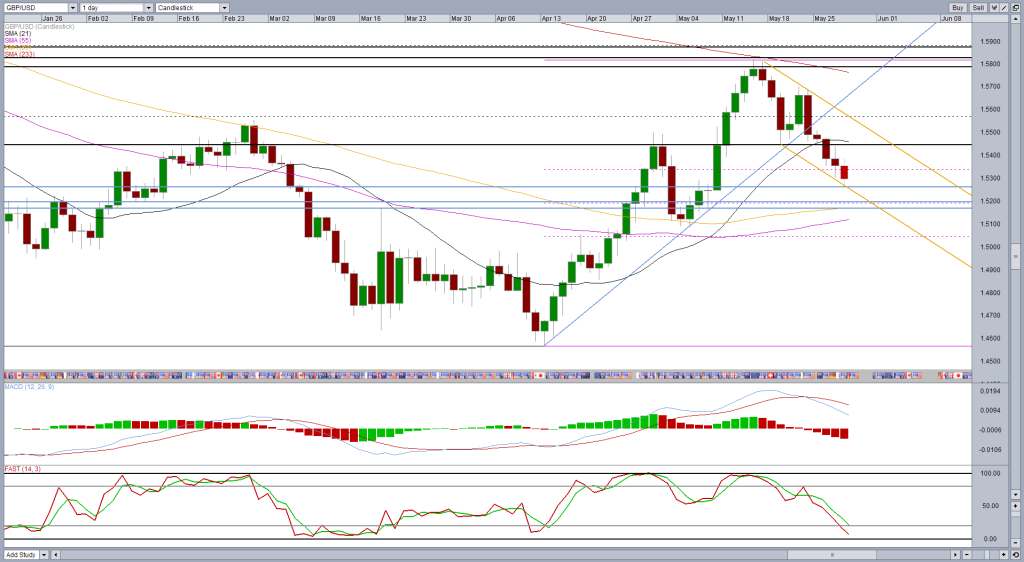
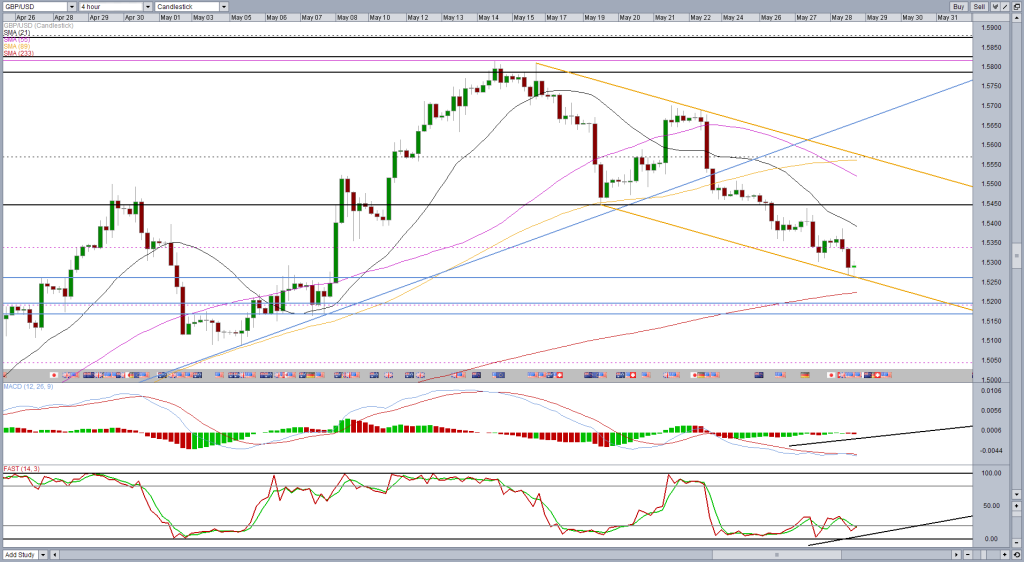
In my piece a couple of days ago (GBPUSD – Dollar Regains Control in Cable Battle) I highlighted the 1.5170-1.5220 region as potentially being key after the pair broke through a number of support levels and the dollar asserted its dominance.
This region was particularly notable as asidefrom previously being a key region of support and resistance, it also marks the 50% retracement of the move from 13 April lows to 14 May highs and the reversion to the 89-day simple moving average. Often in the past, price action has bounced off the 89-DMA and the trend continued. When it hasn’t it has been a good indication that the trend has changed.
Upon approaching this level, we are seeing signs that it will once again prove to be a barrier to price action as momentum is being lost despite price action making new lows. In other words, we’re seeing a divergence between price action and the stochastic and MACD.
While these are secondary indicators to price action and I do prefer to see confirmation of the trend change, they do act as useful warning signs that a trend is weakening which tends to come before a reversal. This could be as simple as a hammer on the daily chart or even better, bullish engulfing pattern or something similar.
 *The position ratio tool and many others can be found in OANDA Forex Labs.
Content is for general information purposes only. It is not investment advice or a solution to buy or sell securities. Opinions are the authors; not necessarily that of OANDA Business Information & Services, Inc. or any of its affiliates, subsidiaries, officers or directors. If you would like to reproduce or redistribute any of the content found on MarketPulse, an award winning forex, commodities and global indices analysis and news site service produced by OANDA Business Information & Services, Inc., please access the RSS feed or contact us at info@marketpulse.com. Visit https://www.marketpulse.com/ to find out more about the beat of the global markets. © 2023 OANDA Business Information & Services Inc.


