Gold at six-week high
A warning from Apple yesterday about not hitting Q1 targets due to the impact of CoVid-19 started gold on an upward trajectory yesterday. Apple’s warning comes as other corporates update markets about supply chain issues as a result of the shutdown of some of China’s manufacturing capability, and raises fears that the nascent global growth could be nipped in the bud.
Adding to gold’s appeal was the news that the death toll from the virus had topped the 2,000 mark and as at 11.30am Singapore time, it had reached 2,010. The total number of confirmed cases was 75,199 with 74,186 in mainland China (Source: Johns Hopkins University). Though the numbers keep rising, yesterday’s total of new cases was the lowest since the methodology of reporting was changed on February 13.
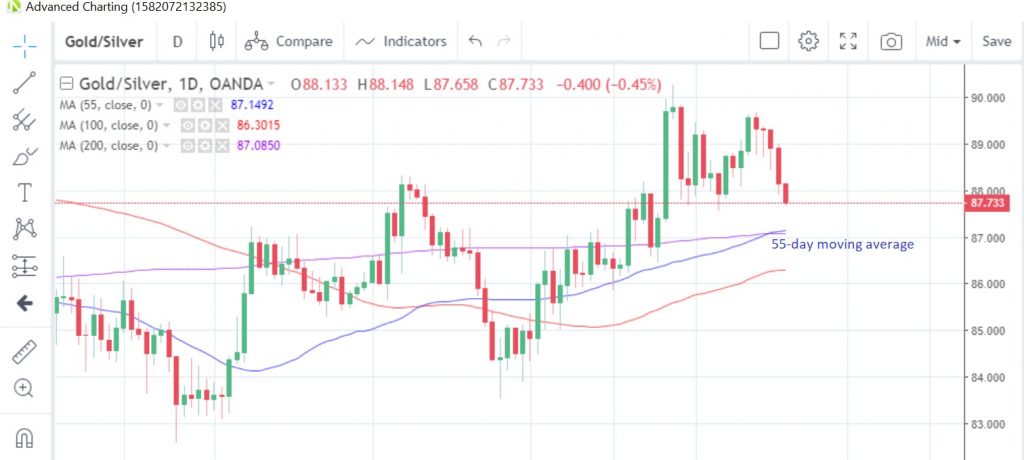
Gold surpassed the 1,600 mark for the first time since January, hitting the highest since the January 8 peak of 1,612. Prices are little changed today but the surge yesterday forced the gold/silver (Mint) ratio to the lowest level in nearly two weeks. The 55-day moving average at 87.15 is now above the 200-day moving average at 87.085 since Monday and offers the first technical support level to the downside.
Gold/Silver Daily Chart
Corporate China starts to hurt
Local press is reporting that a growing number of private Chinese companies have either cut wages, delayed pay checks or even stopped paying staff altogether as the impact of CoVid-19 worsens. The reports say the economic toll of the virus has meant they cannot cover their labour costs. It’s not impossible to assume that, with the supply chain disruptions, the impact might start to be felt further afield, not just in China.
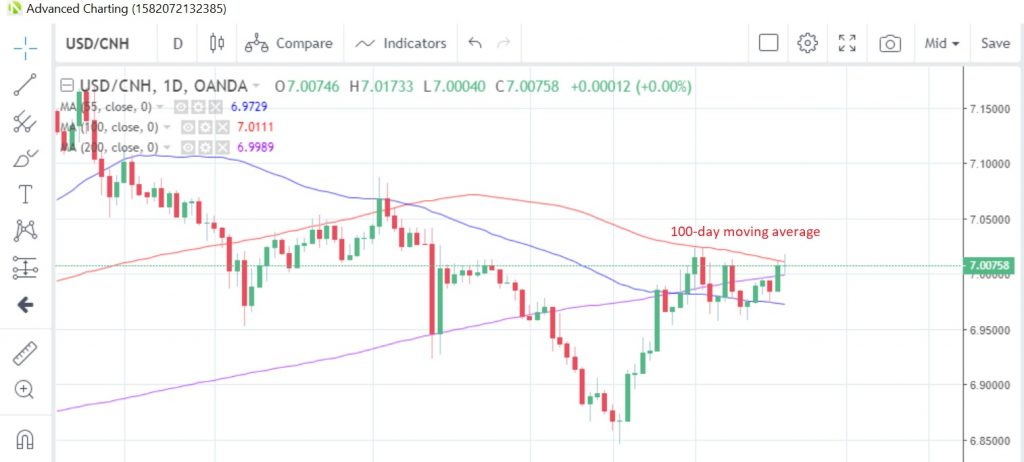
Strangely, the China50 index is having a good day today, recouping almost all of yesterday’s losses as it rebounds from the 200-day moving average at 13,620. USD/CNH is little changed today after surpassing the 7.0 mark yesterday for the first time in eight days. It’s now testing the 100-day moving average at 7.0111, which has capped prices on a closing basis since December 4.
USD/CNH Daily Chart
A US housing slump?
Data today could show that US housing starts fell 30.7% in January, according to the latest survey of economists. That’s a dramatic drop from the +16.9% posted in December and the worst reading on records going back to 2016. Building permits are seen better, with only a 0.1% decline forecast for the month.
Aside from housing, we see US producer prices and speeches from Fed’s Mester, Kashkari and Kaplan ahead of the release of the minutes of the last FOMC meeting.
Prior to all this, the European calendar features UK’s PPI, CPI and RPI for last month and Euro-zone construction output and current account data for December.
The full MarketPulse data calendar can be viewed at https://www.marketpulse.com/economic-events/
Content is for general information purposes only. It is not investment advice or a solution to buy or sell securities. Opinions are the authors; not necessarily that of OANDA Business Information & Services, Inc. or any of its affiliates, subsidiaries, officers or directors. If you would like to reproduce or redistribute any of the content found on MarketPulse, an award winning forex, commodities and global indices analysis and news site service produced by OANDA Business Information & Services, Inc., please access the RSS feed or contact us at info@marketpulse.com. Visit https://www.marketpulse.com/ to find out more about the beat of the global markets. © 2023 OANDA Business Information & Services Inc.


