Once again we are faced with the age old question – is current trend bullish or bearish?
From a closing price point of view, it does seem that there is some slight bearish pullback. S&P 500 loss 0.11% yesterday, while Nasdaq 100 shed 0.78%. Dow Jones ended flat (-0.00%) but remained in the red zone nonetheless trading 0.45 points lower.
This decline seems to be justified on the fundamental front as well, all the US economic data released yesterday were bearish bar Continuing Claims which stood at 2.84 million versus an expected 2.85 million. However even this number isn’t truly bullish as the numbers is higher than previous week’s 2.82 million. The rest of the economic numbers were all worse than expected – Initial Jobless Claims grew to 326K vs 317K expected, while Trade Balance deficit has widened to $42.3B. Composite and Services PMI gauges compiled by Markit were also both lower than expected – continuing the early week Manufacturing PMI disappointment. Similarly, ISM non-manufacturing PMI followed its own Manufacturing PMI disappointment as well, but at least it is the only the economic gauge that saw a stronger expansion rate compared to previous month. But amidst all these negativity, this provided scant comfort and it is not surprising to see US stocks trading lower accordingly.
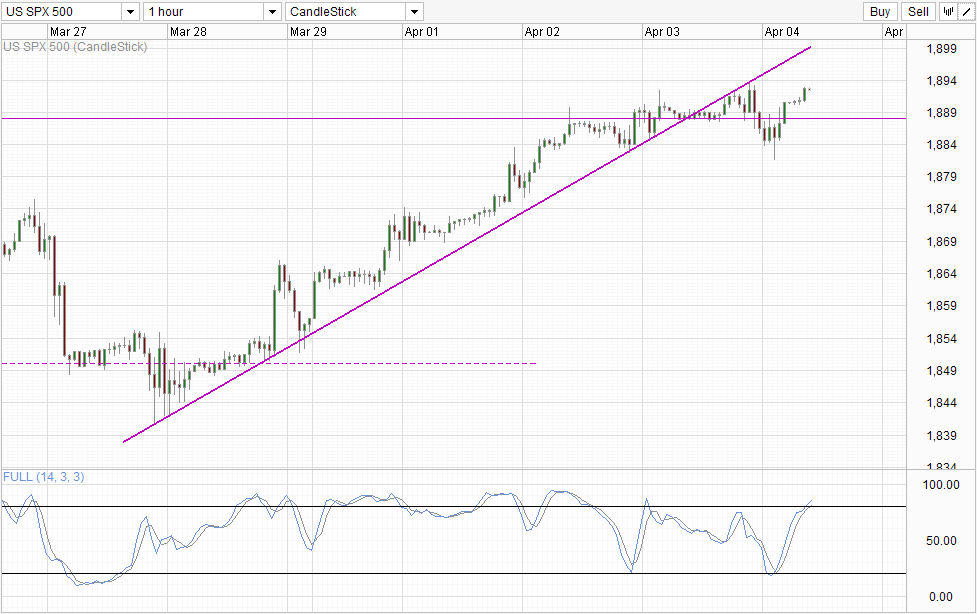
Hourly Chart
This does suggest that current trend is mildly bearish, as trend was already threatening to reverse back on Wednesday, and now that we have fundamental support for further bearish push it seems intuitive that prices would/should be trading lower in the near future. When we consider that today is the last trading day of the week, the bearish pressure becomes even higher as the likelihood of previously bullish traders taking profit ahead of the Non-Farm Payroll news event later.
However, it seems that bulls are not ready to roll over yet. Despite all the bearishness, prices managed to find support around the 1,884 – 1,885 support level. Perhaps more importantly, we are seeing bullish push extending into the Asian time zone, with prices currently pushing towards recent record high once more.
The work has been cut out for the bulls though, prices will need to overcome the previous swing high of 1,894 and move higher towards the rising trendline which is likely to be the confluence with 1,900. Failure to break the trendline/1,900 level may invite bearish selling once again especially since bullish momentum is overbought and a significant bearish pullback is likely. That being said, if trendline/1,900 is broken then the likelihood of further bullish push becomes even higher as current euphoria will be able to last for a while more.
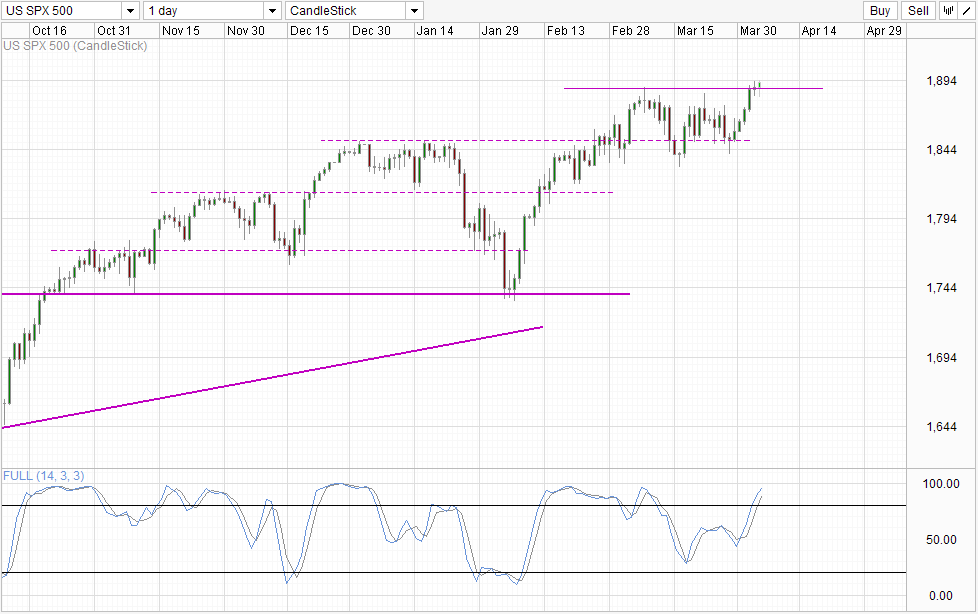
Daily Chart
This notion is supported by Daily Chart, which seems to suggest that the next leg of bullish extension is currently in play. A potential bearish reversal pattern has also been averted and instead we are seeing a continuation of the bullish momentum as the spinning top candlestick turned out to be a point of inflexion. Similar to S/T chart, Stochastic readings are within the Overbought region but they can be ignored as strong momentum tends to invalidate counter-trend signals from cyclical indicators such as Stochastic. Nonetheless, if this break of 1,888 proves to be a “fakeout”, the bearish reprisal will be high and traders who are chasing this bullish train will need to keep this in mind when considering the risk involved.
More Links:
GBP/USD – Pound Slides As Services PMI Falters
USD/CAD – Loonie Steady As Canadian Trade Balance Improves
AUD/USD – Slightly Lower After Sluggish Australian Retail Sales
This article is for general information purposes only. It is not investment advice or a solution to buy or sell securities. Opinions are the authors; not necessarily that of OANDA Corporation or any of its affiliates, subsidiaries, officers or directors. Leveraged trading is high risk and not suitable for all. You could lose all of your deposited funds.


