US stocks slipped once more yesterday with S&P 500 closing 0.13% lower. This loss was mostly expected as price action favored further bearish movement, but the manner which the 0.13% loss was made certainly was surprising.
Hourly Chart
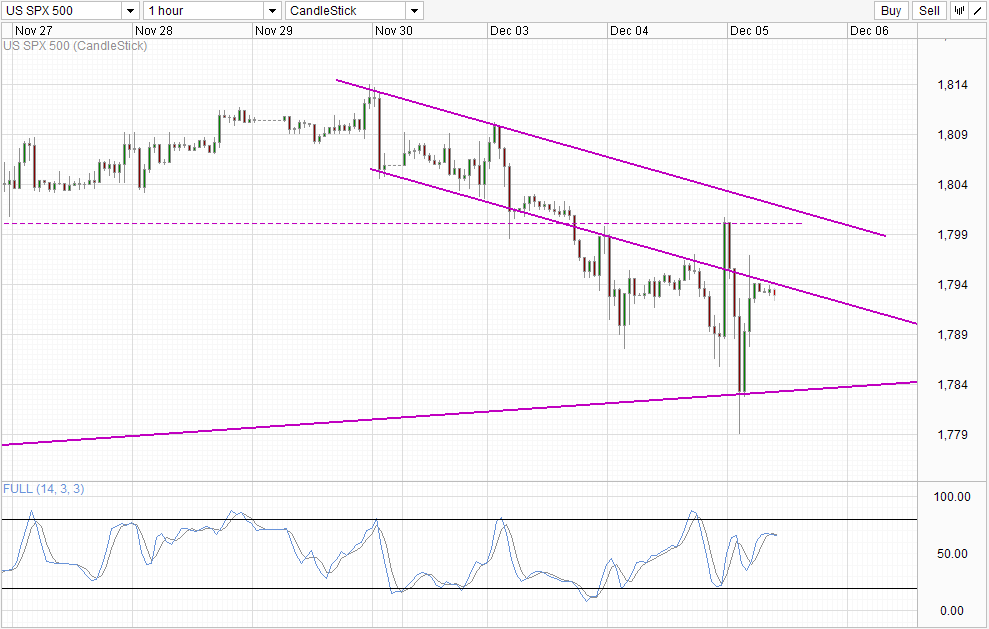
Price was mildly bullish during Asian/Early European session, heading towards Channel Bottom and finding resistance there before being pushed back down lower again, reaching a low of 1,786 before the bell rung in US Stock exchanges. All these were within expectation as price action remain bearish in the short-term. What is unexpected is the strong bullish action that emerged shortly after the Stock market opened, where prices quickly pushed up to a high of 1,800 round figure out of the blue.
Looking at the economic news calendar, it is likely that the rally was brought about by US New Home Sales figures that were released at the exact same time the rally started. October New Home Sales stood at 444K, much higher than the expected 429K and head and shoulders above September’s 354K. This improvement in the housing market suggest that US economic recovery is strong, and the immediate bullish reaction is a clear indication that market interpret this as a bullish outcome, once again weakening the argument that good economic news are triggering taper fears. Furthermore, it should be noted that the rally lasted for a full hour, hence if indeed QE lovers were worried, they would have made short work of the rally much earlier rather than waiting 1 hour later and then somehow coming back to their senses and remembering that they need to short.
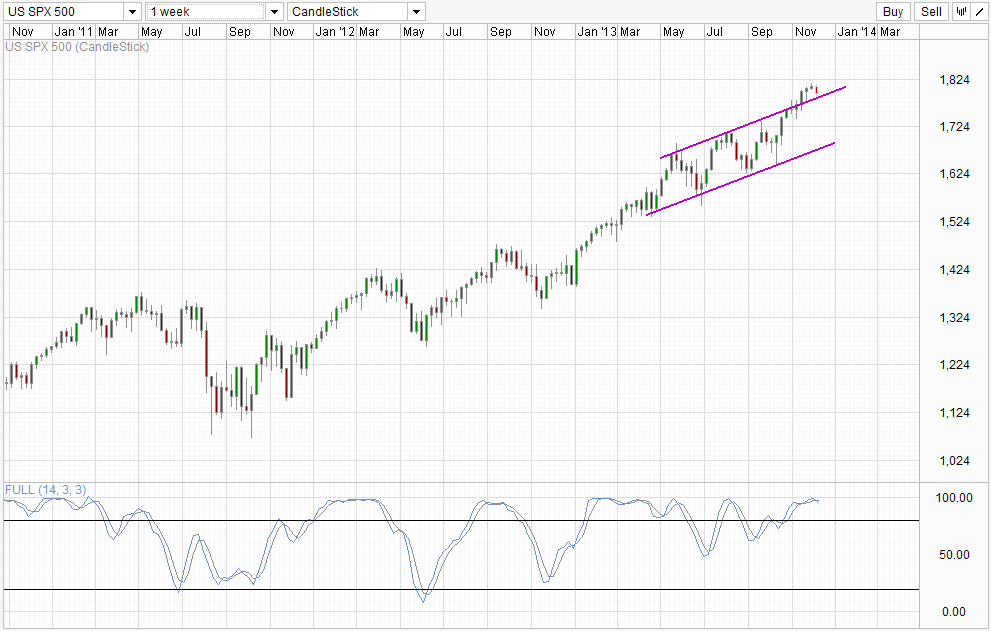
Nonetheless, the sharp decline that followed needs to be addressed, and once again technicals may be a better explanation than the supposed QE taper fears. Considering that S&P 500 was inherently bearish in the short-term, it is not surprising that a sharp bearish reply happened with bulls most likely overextending. The fact that the bearish sell-off stopped just at the rising trendline (Channel Top from the weekly chart seen below) lends further support to this hypothesis, with the follow-up bullish rebound being kept by Channel Bottom providing yet another nail to seal this assertion.
What this imply is that bearish momentum is still in play, and we could yet see one more day of losses for US stock today. However, it is important to note that the European Central Bank would be making its Dec rate decision today, which may swing global risk sentiment and potentially reverse current bearishness in S&P 500. However, even if price manage to break into the descending Channel once again, the likelihood of a push above 1,800 may be difficult as this key psychological round figure would likely be confluence with Channel Top today, and favoring bearish pullbacks moving ahead.
Weekly Chart
With regards to long-term trend, if Taper Fears are no longer exerting the same influence as before, the bullish reaction/follow-through should Fed holds current QE program in the Dec FOMC meeting will be limited. Hence, the likelihood of prices breaching into the rising Channel increases. However, it should be noted that the Santa Claus Rally effect may still come into play, and December is also a notably volatile month due to lack of volume. Therefore bearish traders should not automatically assume that Channel Bottom is for the taking, as stronger directional trend may only fully emerge/confirmed in early 2014.
More Links:
GBP/USD – Maintains above Key Level of 1.6350
AUD/USD – Reaches Three Month Low below 0.90
EUR/USD – Settles below Key Level at 1.36
This article is for general information purposes only. It is not investment advice or a solution to buy or sell securities. Opinions are the authors; not necessarily that of OANDA Corporation or any of its affiliates, subsidiaries, officers or directors. Leveraged trading is high risk and not suitable for all. You could lose all of your deposited funds.


