US stocks suffered another heavy drop yesterday, extending losses suffered on Friday. Both S&P 500 and Dow Jones Industrial Average shed an more than 1%, while losses in Nasdaq 100 was slightly modest at 0.89%, but this drop meant that the Tech heavy index has now clocked in the worst 3-day drop since 2011.
As there isn’t any new bearish economic numbers released yesterday, it is clear that market sentiment is simply bearish. It should also be noted that the pace of decline during US session was much faster than during Asian/European session. This shouldn’t come as a surprise as US traders have been noted to be more bearish than Asian/European counterparts previously. What is more interesting is the fact that non-US traders appears to be shifting their previously bullish sentiment. As previously mentioned, should the rest of the world begin to exhibit bearish sentiment, it is possible that a deeper bearish correction would take place as global traders would be moving in step together.
Hourly Chart
From a technical perspective, price is currently facing resistance from upper wedge and if the above assertion about shift in sentiment is correct, then we should be expecting prices to trade lower from here and potentially breaking the 1,843 soft support level. That being said, strong bearish follow-through in the immediate future may be less likely as Stochs have been trending lower without any short-term fundamental support. Stochastic indicator also does not favor strong bearish pushes from here as readings are close to the Oversold region. Similarly, lower wedge may provide support as well, and given that prices have been falling like a stone without any significant pullback, the possibility of a “dead-cat bounce” is not out of the window, and as such do not be surprised to see some price rebounding later.
Daily Chart
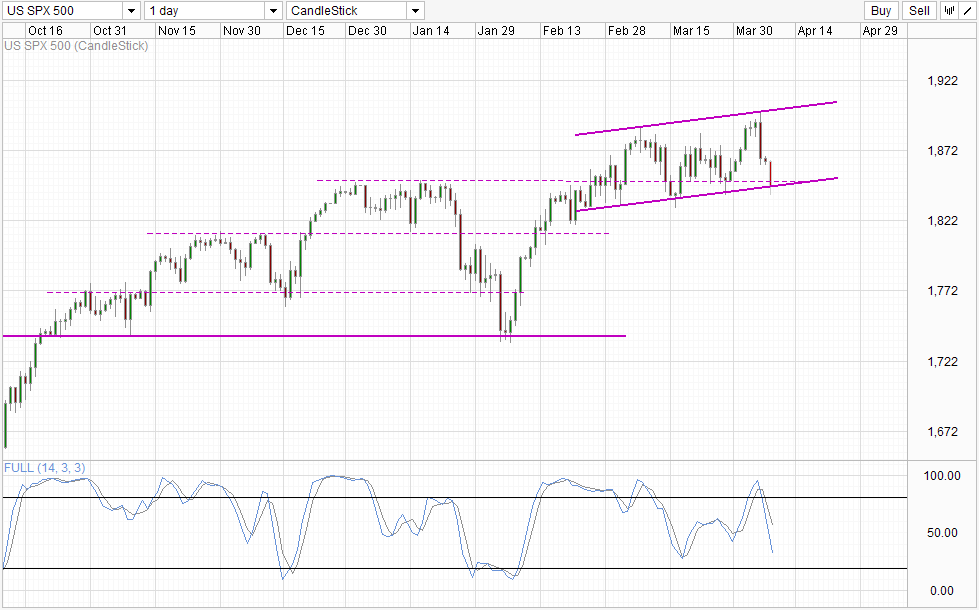
Daily Chart suggest that bullish momentum is still in play though, and a more throughout break of Channel Bottom is necessary to confirm the bearish breakout. This is needed because we’ve seen long tails pushing below the Channel Bottom previously, and there is a chance that the same could happen again. Conservative traders will also notice that current bearish cycle is more than 50% over according to the Stochastic indicator, which implies that momentum will most likely be Oversold when 1,812.5 support is reached. As such, these traders may actually wish to wait for a stronger breakdown of bullish momentum (e.g. break of 1,812.5) in order to verify that bull trend is indeed over.
More Links:
GBP/USD – Pound Moves Higher In Subdued Trading
Gold Slips After Strong US Nonfarm Payrolls
USD/CAD – Steady After Strong Canadian Employment Data
This article is for general information purposes only. It is not investment advice or a solution to buy or sell securities. Opinions are the authors; not necessarily that of OANDA Corporation or any of its affiliates, subsidiaries, officers or directors. Leveraged trading is high risk and not suitable for all. You could lose all of your deposited funds.


