- Bitcoin price breaks above $70k for the first time since July, driven by decreased OTC desk inflows.
- US spot ETFs see a surge in inflows, potentially linked to the upcoming US election and perceived pro-crypto stance of Donald Trump.
- Despite the pullback, bullish pressure remains, with the possibility of Bitcoin reaching new highs if inflows continue.
Most Read: US Earnings: Reddit, Alphabet Beat Estimates, Nasdaq 100 Retreats with Meta Up Next
Bitcoin prices have finally broken above the$70k handle this week, the first time the worlds largest cryptocurrency is trading above the $70k handle since July. Over the last 7 days BTC/USD rose 8% in 7 days before taking a breather today and trading down 1% at the time of writing.
OTC Inflows Decline Help Bitcoin Rally
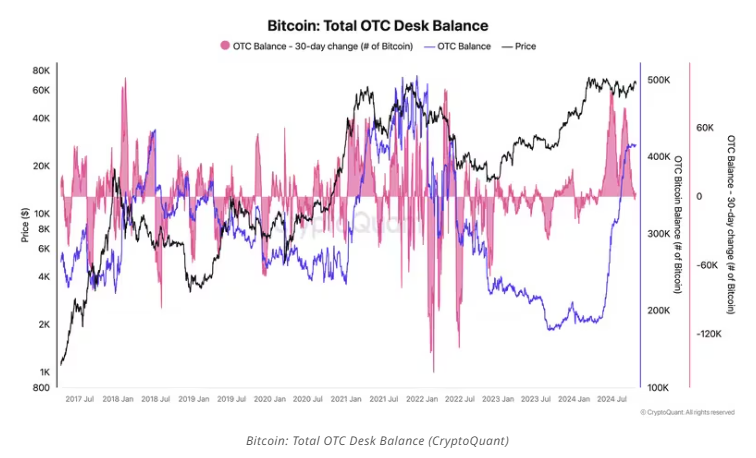
A notable aspect of the recent rise in bitcoin is that OTC desks, where two parties can trade directly and privately, now have 416,000 BTC (worth $30 billion). This is much higher than the average of less than 200,000 BTC they held during the first quarter, based on CryptoQuant data.
OTC desks are mainly used by big companies or wealthy people who don’t want their trades to show up on public crypto exchange records. This lets them buy or sell large amounts without changing the market price. More trades going to OTC desks is one reason why bitcoin’s price has stayed mostly flat for the last seven months. With an abundance of bitcoin on OTC desks, the U.S. spot-listed exchange-traded funds (ETFs) could make purchases without affecting the spot price.
Source: Coindesk
The amount of bitcoin going into OTC desks each day has dropped to the lowest this year. According to CryptoQuant, in October, OTC desks handled about 90,000 bitcoin daily, which is 52% less than in the first three quarters of the year. This could in part be responsible for the break of the $70k handle.
ETF Flows Surge
ETF flows returned to the offensive recently and continue to surge as the US election draws nearer. Markets have already declared Donald Trump as the pro crypto candidate which could also explain the recent price surge. Betting markets have Trump in a sizable lead, while the most recent Reuters/Ipsos poll paints a much closer race with Kamala Harris holding a slender lead.
Since October 11, spot bitcoin ETFs have taken in nearly $4 billion, with just one day seeing money leave, based on Farside Investors’ data. On Monday, US spot Exchange Traded Funds (ETFs) received $427.60 million, continuing a streak of four days where more money came in. Yesterday saw even more money flow into ETFs, with total inflows of $827 million. The drop in price today could just be a blip, with another positive day of inflows, market participants would hope that fresh high may be incoming.
Source: Coinglass
Technical Analysis BTC/USD
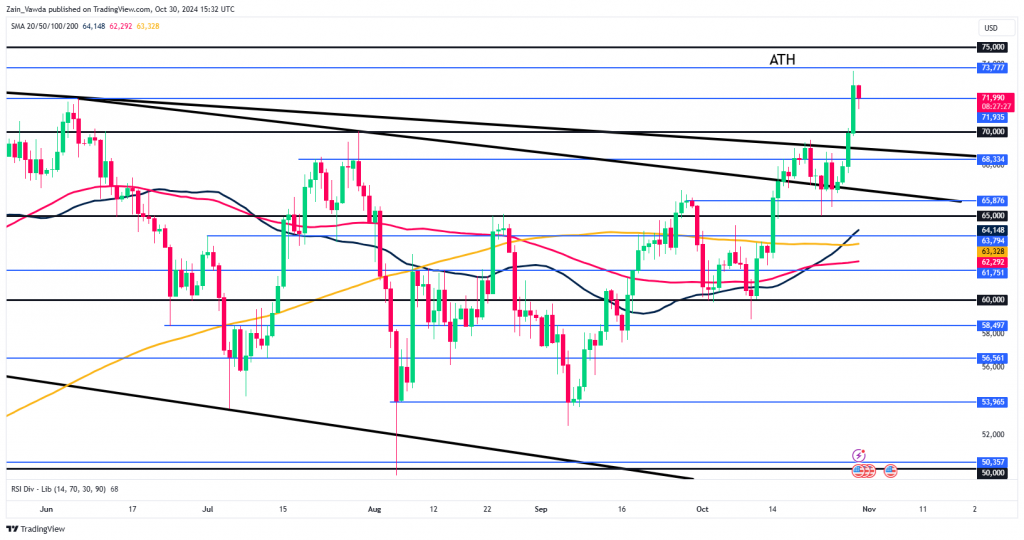
Bitcoin (BTC/USD) is currently experiencing a brief pullback hovering on and around a key area at 72000. As the daily candle stands now, a close inside yesterday’s daily candle seems likely which would result in an inside bar bearish candlestick pattern.
This is obviously no guarantee of further downside as it appears that there is still a lot of bullish pressure. However a retest of the trendline break or the 70000 handle cannot be ruled out.
The confluence area between the 70000 and 68334 could be key for the bullish run to continue and may be worth keeping an eye open.
Immediate resistance rests at 73777 which is the current ATH with 75000 the next area of interest.
Conversely, support rests at 70000, 68334 before the 65876 handle becomes the area of focus.
Bitcoin (BTC/USD) Daily Chart, October 30, 2024
Source: TradingView.com (click to enlarge)
Support
- 70000
- 68334
- 65876
Resistance
- 73777
- 75000
- 80000
Follow Zain on Twitter/X for Additional Market News and Insights @zvawda
Content is for general information purposes only. It is not investment advice or a solution to buy or sell securities. Opinions are the authors; not necessarily that of OANDA Business Information & Services, Inc. or any of its affiliates, subsidiaries, officers or directors. If you would like to reproduce or redistribute any of the content found on MarketPulse, an award winning forex, commodities and global indices analysis and news site service produced by OANDA Business Information & Services, Inc., please access the RSS feed or contact us at info@marketpulse.com. Visit https://www.marketpulse.com/ to find out more about the beat of the global markets. © 2023 OANDA Business Information & Services Inc.


