- Commodities and growth proxies JPY crosses are leading the decline in G10 JPY carry trade basket.
- A widening of the US high-yield corporate bonds credit spread may spark a higher volatile movement in the JPY crosses.
- Key US earnings releases from Visa, Microsoft, and Alphabet are indicating slower global demand spending despite expectations beat.
FX volatility may start to increase as G10 JPY crosses have shaped significant reversal movements
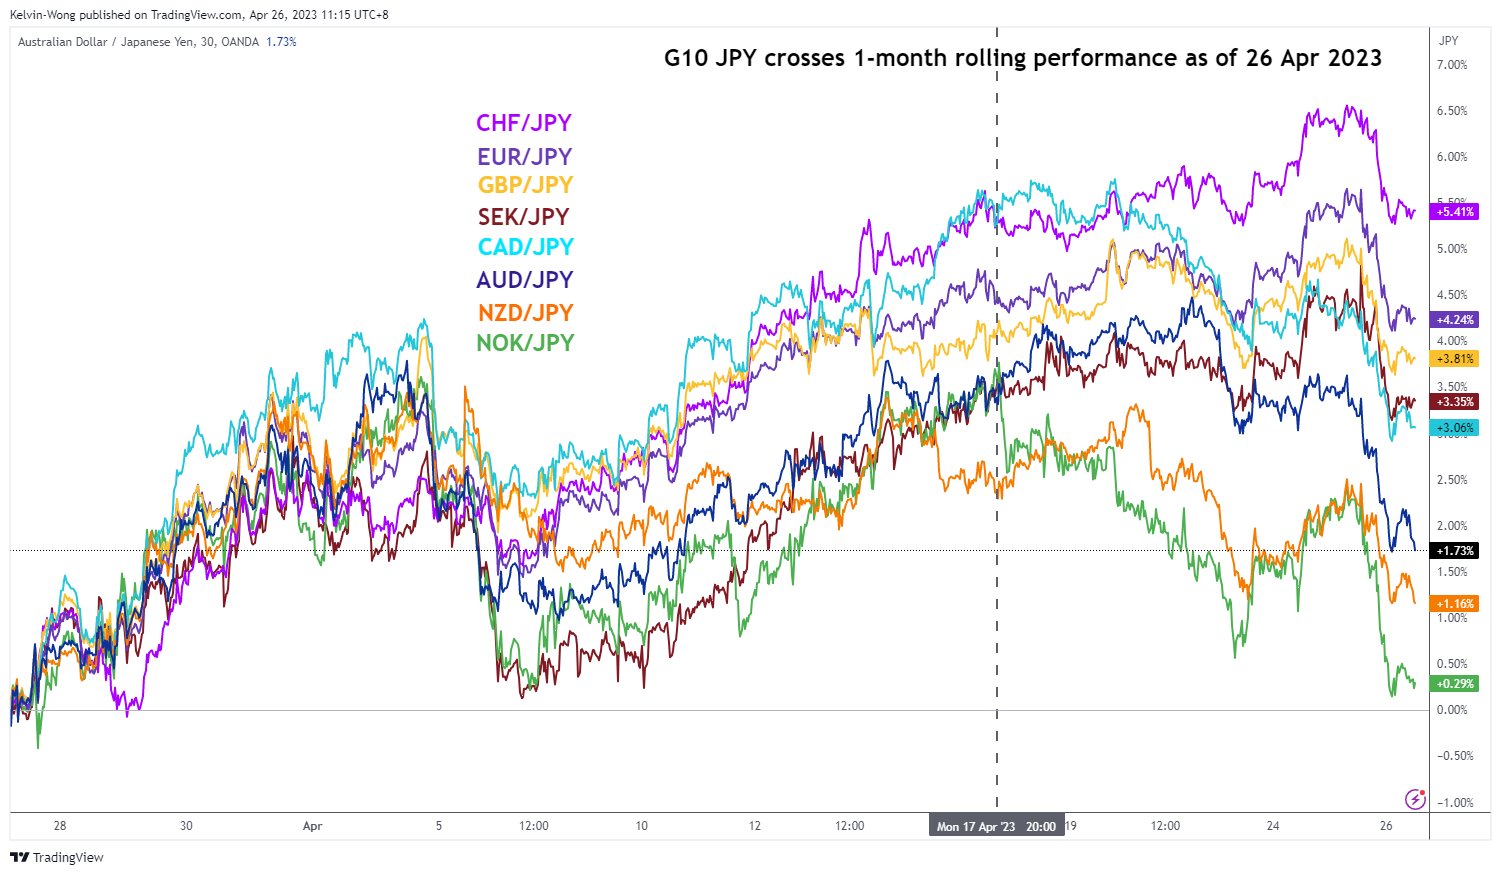
Fig 1: G10 JPY crosses 1-month rolling performances as of 26 Apr 2023 (Source: TradingView, click to enlarge chart)
The G10 JPY crosses have started to exhibit a risk-off liked behaviour due to concerns about global growth expansion.
As for the concerns about global growth, the focus is on the will of China policymakers to implement further liquidity measures to boost domestic economic growth which in turn drives up Chinese consumers and corporate’s spending and investment in international goods and services. That’s a very much needed “support” for the global economy given that the rest of the developed nations’ central banks are still in a tightening mode on their respective monetary policies (except Japan for now, at least in the near term).
The latest guidance from China’s central bank PBoC has indicated that it prefers a “wait and see” approach before implementing any further accommodative measures as recent key economic data such as housing, consumer spending, and industrial production are now in recovery mode.
Therefore, it is interesting to note that the commodities-related JPY crosses (proxies of global growth); NOK/JPY, NZD/JPY, and AUD/JPY have led the recent downside reversal since 17 April 2023 as illustrated on the above chart.
Widening of US high-yield corporate bonds credit spread precedes significant movements on a JPY carry trade basket
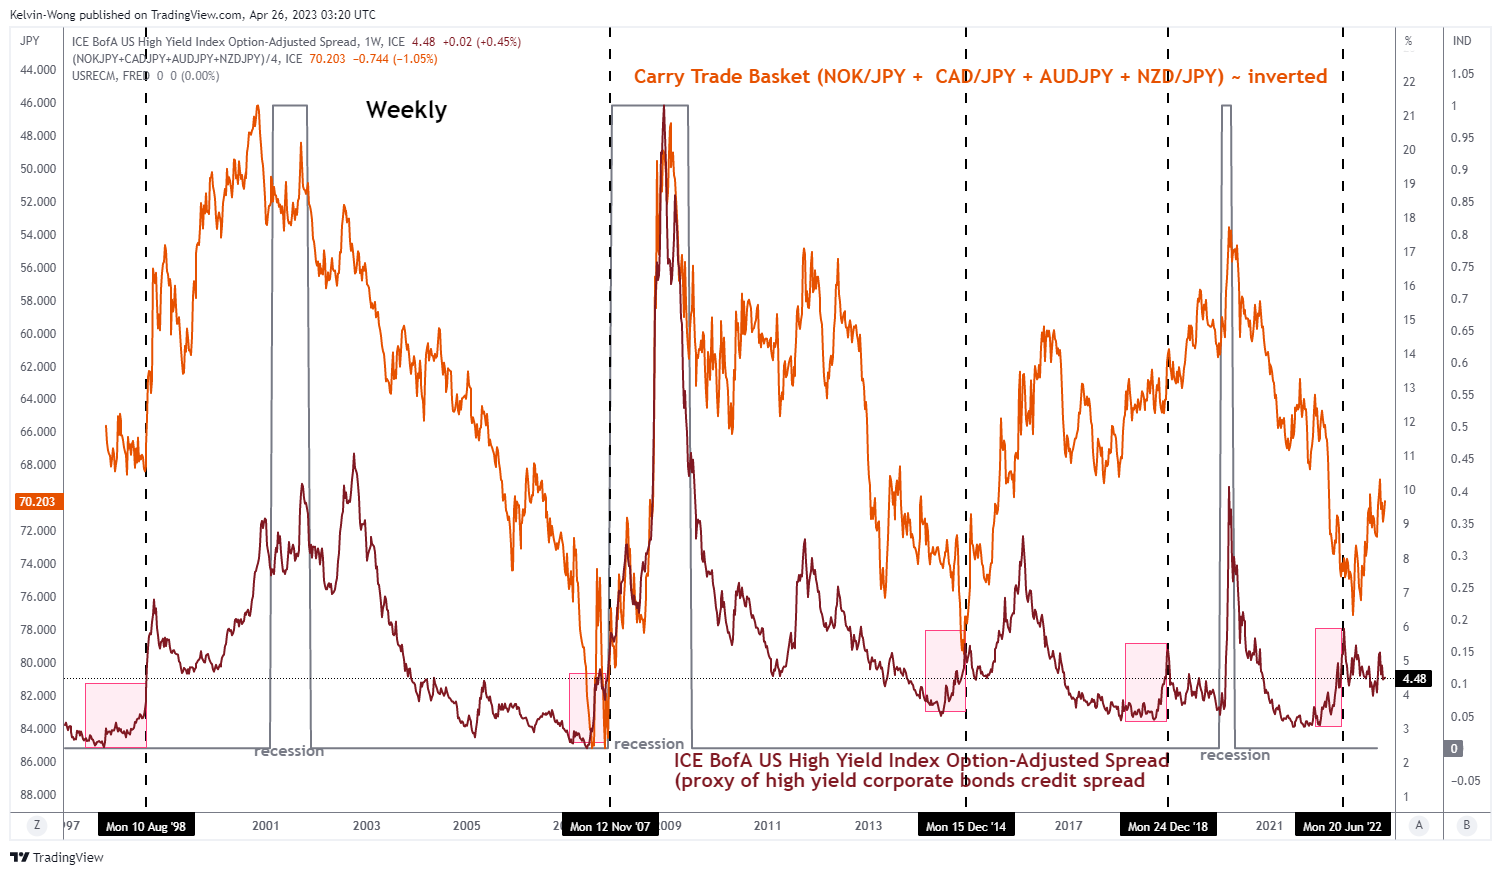
Fig 2: ICE BofA US high yield index option-adjusted spread & JPY carry trade basket as of 24 Apr & 26 Apr 2023
(Source: TradingView, click to enlarge chart)
We have highlighted earlier in a previous article (click here for details) the elements that may trigger an imminent widening of the US high-yield corporate bonds credit spread.
Right now, the focus is on inter-market analysis; the pink-coloured shaded boxes in the above chart highlighted previous episodes in the significant widening of the credit spread in the weekly periods of 10 August 1998, 12 November 2007, 15 December 2014, 24 December 2018, and 20 June 2022 have led to a similar movement of the inverted commodities and growth proxies related JPY carry trade basket (equal weightage of NOK/JPY, CAD/JPY, AUD/JPY & NZD/JPY).
The above-mentioned correlation also has logical economic reasoning as a widening of high-yield corporate bonds credit spread indicates a rising default risk. For such a scenario to take shape, we need to have a credit crunch that led to a slowdown in global growth, which eventually tends to have a negative feedback loop into the JPY crosses due to JPY being a “traditional safe haven and funding currency” of choice by market participants.
Key US earnings releases point to global growth deceleration despite expectations beat by Microsoft, Alphabet & Visa
Visa Inc is a market leader in the online payment business space where its financial data can be used as a proxy to gauge global consumer spending. Its overall net revenue growth for fiscal Q2 2023 slowed to 11% year-on-year from 12% in fiscal Q1 2023, its slowest revenue growth since fiscal Q3 2021.
Microsoft’s crown jewel cloud services business segment; Azure recorded a slower growth for fiscal Q3 2023 at 27% year-on-year from 31% in fiscal Q2 2023, its cloud business revenue growth has recorded four consecutive quarters of slowdown.
Alphabet, the parent company of Google has reported a second consecutive quarter of slowdown in Google advertising revenue that decrease by less than 1% year-on-year in Q1 2023 from a decline of close to 4% posted in Q4 2022.
CAD/JPY Technical Analysis – short-term downside momentum intact below 99.00 key resistance

Fig 3: CAD/JPY trend as of 26 Apr 2023 (Source: TradingView, click to enlarge chart)
The minor uptrend phase of the CAD/JPY cross pair from its 24 March 2023 low of 94.07 to its recent 18 April 2023 high has been damaged and the current observations seen on the 4-hour MACD indicator have indicated a revival of short-term downside momentum.
A break below the intermediate support of 97.10 exposes the next supports at 95.70 and 94.65 (the lower limit of the medium-term sideways range configuration in place since the 19 January 2023 low).
On the other hand, a clearance with a 4-hour close above 99.00 key medium-term pivotal resistance negates the bearish tone to see the next resistance coming in at 100.65 (the upper limit of the sideways range configuration).
Content is for general information purposes only. It is not investment advice or a solution to buy or sell securities. Opinions are the authors; not necessarily that of OANDA Business Information & Services, Inc. or any of its affiliates, subsidiaries, officers or directors. If you would like to reproduce or redistribute any of the content found on MarketPulse, an award winning forex, commodities and global indices analysis and news site service produced by OANDA Business Information & Services, Inc., please access the RSS feed or contact us at info@marketpulse.com. Visit https://www.marketpulse.com/ to find out more about the beat of the global markets. © 2023 OANDA Business Information & Services Inc.

Kelvin Wong
Passionate about connecting the dots in the financial markets and sharing perspectives around trading and investment, Kelvin Wong is an expert in using a unique combination of fundamental and technical analyses, specializing in Elliott Wave and fund flow positioning, to pinpoint key reversal levels in the financial markets.
In addition, over the last ten years, Kelvin has conducted numerous market outlook and trading-related seminars, as well as technical analysis training courses, for thousands of retail traders.
Latest posts by Kelvin Wong (see all)
- Nasdaq 100 Technical: At risk of staging a multi-week corrective decline - 20 December 2024
- Gold Technical: A less dovish Fed may reinforce a medium-term corrective decline - 16 December 2024
- AUD/USD: Surviving at the 0.6360 key support (for now) but the long-term trend remains bearish - 13 December 2024