- Dow Jones Industrial (DJIA) benefits as market participants diversify their holdings.
- Nvidia leads a recovery for the chip sector following 3.02% of losses yesterday.
- S&P 500 and Nasdaq 100 face a major test of a key resistance level if the recovery is to continue.
Fundamental Overview
U.S. indices have experienced an intriguing start to the week, with the tech-heavy Nasdaq and S&P 500 facing selling pressure. The continued decline in Nvidia’s stock price has negatively impacted both indexes, while the Dow Jones Industrial Average benefited as market participants sought diversification. As outlined in my weekly outlook, fund flows indicated a second consecutive week of selling in U.S. equities, suggesting that some investors may be taking profits ahead of a potential market retracement.
Following significant psychological levels being hit by both the Nasdaq and S&P 500, it would appear as though market participants are repositioning ahead of this week’s US PCE data release. Sectors that seem to be benefiting appear to be the financials and the energy sector, with the expectation for a tighter oil market in the summer a likely factor as well.
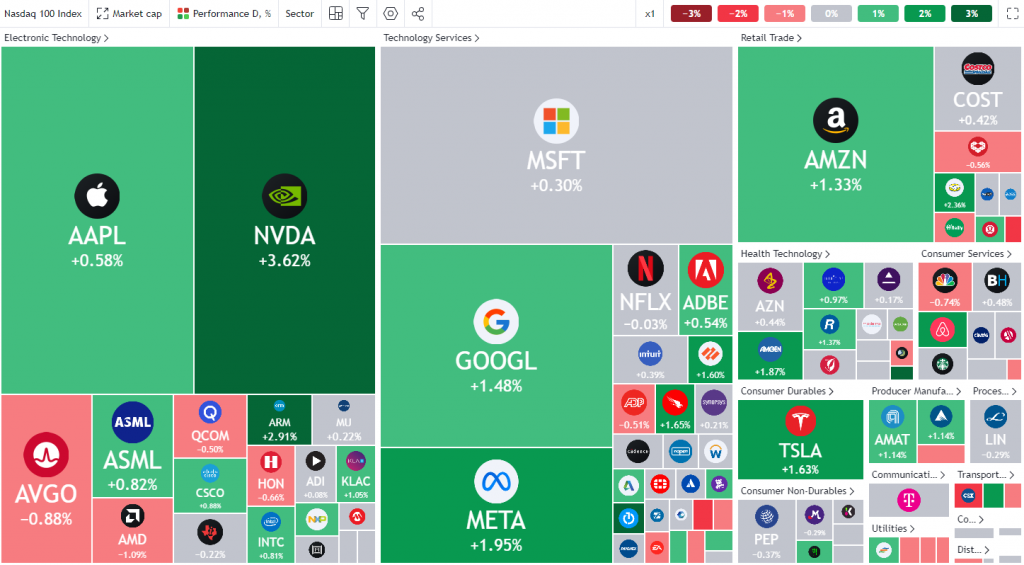
AI linked stocks fell yesterday with names like Taiwan Semiconductor manufacturing (TSM), Broadcom and Qualcomm dropping between 3.5% and 5.7%, which put pressure on the tech heavy Nasdaq. The chip stock index ended Monday down 3.02%. This morning has brought a bit of optimism, as Nvidia is staging a recovery along with the chip index. Nvidia was up 3.53% at the time of writing.
Nasdaq 100 Heatmap
Source: TradingView.Com (click to enlarge)
Meanwhile Microsoft joins a list of Tech companies which have caught the eye of antitrust regulators. The company is under scrutiny in Europe regarding the Microsoft Teams app and communication platform. The European Commission stated that they are concerned that Microsoft may be giving its Teams communication channel an unfair advantage by tying it to its popular productivity suite for businesses.
This comes a day after the European Union charged Apple with failing to comply with a new digital competition system. This leaves Apple with a potential fine of as much as 10% of the company’s worldwide revenue.
The Week Ahead
Looking ahead to the rest of the week, earnings are back in focus with a host of releases. The main ones look like Micron and Nike, due out on Wednesday and Thursday (after market close) respectively. Other notable names include FedEx (after market close) today and Levi’s (after market close) tomorrow.
The week wraps up on Friday with the US PCE data release (Fed’s preferred inflation gauge) with consensus for a soft print. Should a soft print materialize, market participants could increase their bets on a rate cut from the Federal Reserve which could lead to some short-term US Dollar weakness and should in theory boost US indices.
For all market-moving economic releases and events, see the MarketPulse Economic Calendar.
Dow Jones Technical Outlook
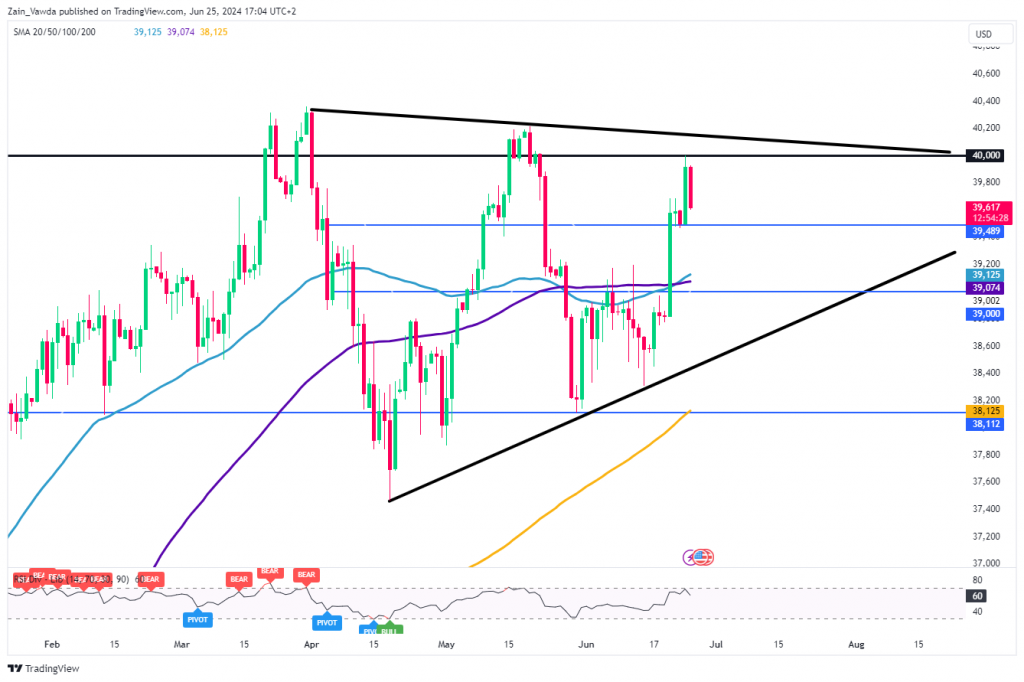
The technical picture for the Dow Jones Industrial Average is giving mixed signals with a series of lower high and higher lows since the beginning of April 2024. As you can see on the chart below we have a wedge pattern in play and is usually the precursor to a breakout as prices become compressed within the wedge structure.
The Dow tapped into the psychological 40000 mark yesterday before a pullback today has price within a whisker of the key support area around 39500. A break below this support could bring the 50 and 100-day MAs into focus, around the 39100 handle. Looking at the MAs, the 50-day MA has just crossed above the 100-day MA in what is usually a sign of momentum, in this case bullish momentum. A retest of the MAs may present a good risk-to-reward opportunity for potential longs.
A break above the 40000 level may need a catalyst, which could come in the form of US PCE data on Friday. Earnings this week are unlikely to make a huge splash, particularly when it comes to indices. Nike for example has a 1.9% weighting in the Dow and is thus unlikely to drive any major moves.
Dow Jones Daily Chart – June 25, 2024
Source: TradingView.Com (click to enlarge)
For a full technical and fundamental breakdown of the S&P 500 and Nasdaq 100.
Content is for general information purposes only. It is not investment advice or a solution to buy or sell securities. Opinions are the authors; not necessarily that of OANDA Business Information & Services, Inc. or any of its affiliates, subsidiaries, officers or directors. If you would like to reproduce or redistribute any of the content found on MarketPulse, an award winning forex, commodities and global indices analysis and news site service produced by OANDA Business Information & Services, Inc., please access the RSS feed or contact us at info@marketpulse.com. Visit https://www.marketpulse.com/ to find out more about the beat of the global markets. © 2023 OANDA Business Information & Services Inc.


