- US PPI data came in weaker than expected, leading to increased rate cut bets and a rise in US indices.
- Th Immediate resistance for the S&P 500 is at 5421, with support at 5330.e June-August period is historically the second-strongest 3-month period for the S&P 500, averaging a 3.2% return.
- Immediate resistance for the S&P 500 is at 5421, with support at 5330.
MostRead: GBP/USD Edges Higher as Wage Growth Hits Lowest Level in 2 Years
Wall Street’s main indexes have continued their upward trend today, partly due to the weak US PPI data. The Producer Price Inflation figures showed a year-on-year increase of 2.2%, a significant decrease from the previous 2.6%.
The core PPI fell to 2.4% from 3% the prior month, with a month-on-month rise of only 0.1%. This data has led market participants to increase their rate cut bets, benefiting US indices.
Examining individual stocks, Starbucks surged nearly 10% in premarket trading after naming Chipotle’s Brian Niccol as CEO. Following the US market opening, Nvidia climbed 4.5%, and Tesla increased by 3.75%. In terms of sector performance, the Tech sector is leading, up 1.47% at the time of writing.
S&P 500 Sector Summary
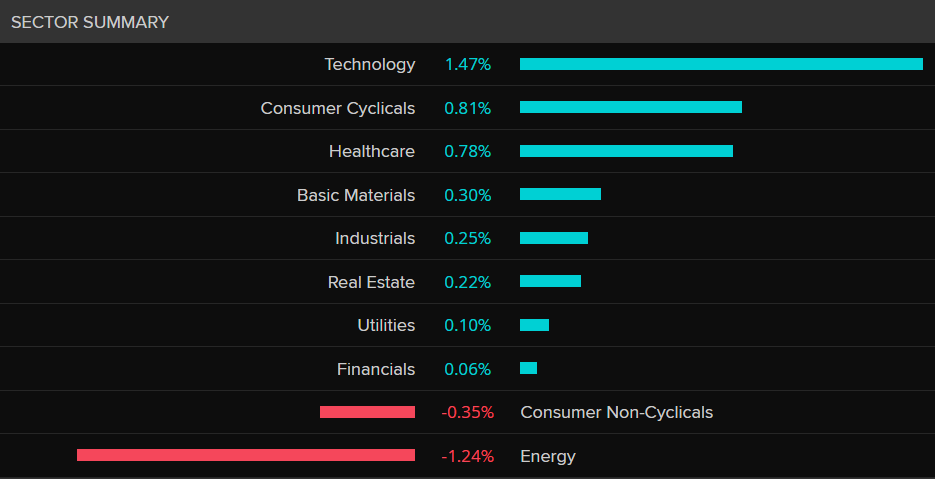
Source: LSEG
Seasonality
A couple of weeks back we took a look at seasonality and how it might affect markets. I have come across a new chart that looks at the performance of the S&P 500 over various three-month periods during the year.
According to the data the June-August period is the second strongest 3 month period, averaging a return of 3.2%. The index has also recorded gains 65% of the time during this period dating all the way back to 1928.
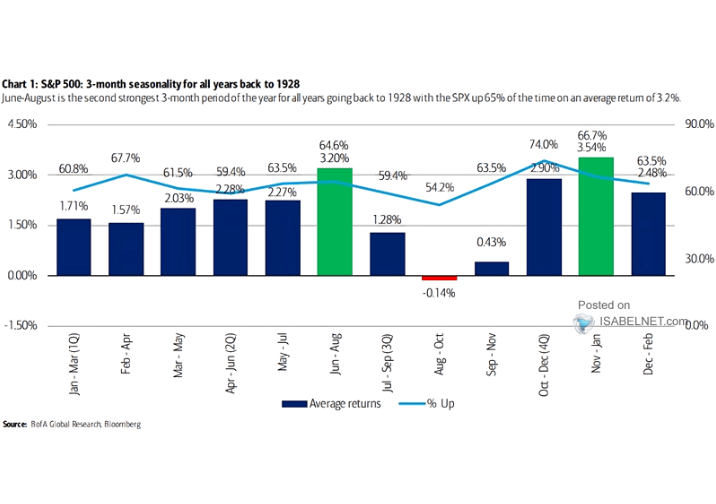
Source: Bloomberg, BofA Research, Isabelnet
The previous seasonality analysis also examined US election years, revealing a slight dip in US indices during September and October of election years, followed by a post-election and Santa rally in December.
This information could be valuable as the S&P 500 continues to climb and the election approaches. However, this year comes with several other challenges affecting market sentiment, which must also be taken into account.
As we look ahead to the remainder of the week, key data releases such as US inflation, retail sales, and Michigan consumer sentiment are expected. Combined with geopolitical developments, these factors could significantly impact the market for the rest of the week.
Technical Analysis S&P 500
From a technical perspective, the S&P 500 has been noteworthy since the lows on August 5.
A bullish engulfing candle at the end of last week was followed by two days of indecision before today’s rise after the data release.
On the daily chart, the overall structure remains bearish, with a break and daily close above the 5538 swing high needed to confirm a bullish trend.
Immediate resistance is at 5421, with the 5500 level becoming relevant again after that.
On the downside, support is at 5330, aligning with the 100-day moving average, before reaching the 5267 level.
S&P 500 Daily Chart, August 13, 2024
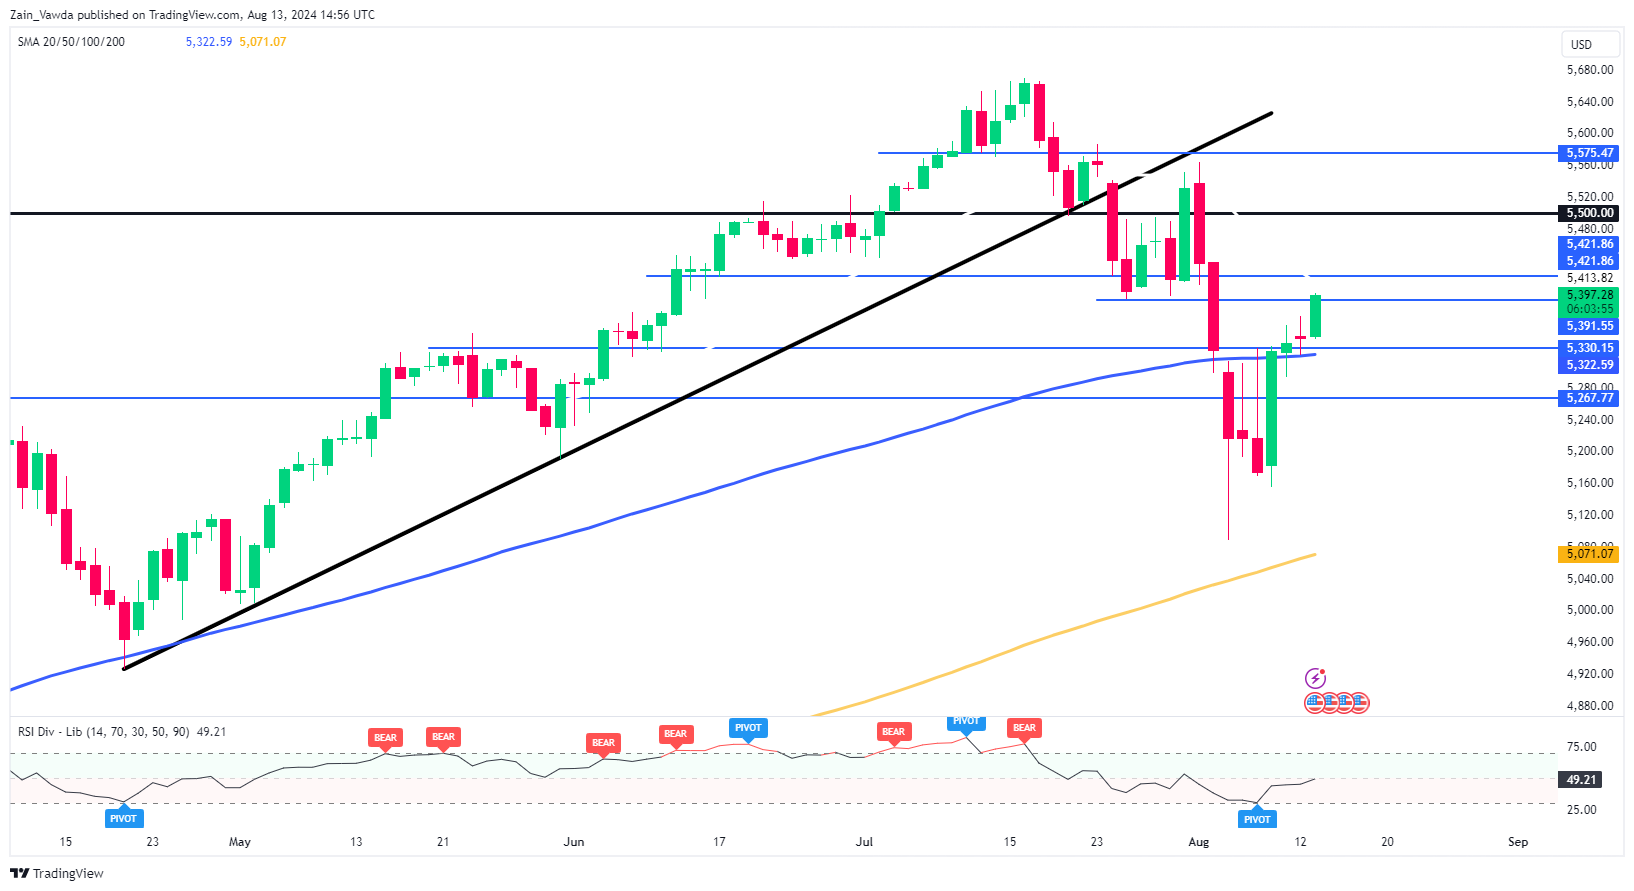
Source: TradingView (click to enlarge)
Support
- 5330
- 5267
- 5200
Resistance
- 5421
- 5500
- 5575
I’ve discovered another valuable tool that could provide insights into market movements. The following report examines the frequency with which the S&P 500 closes in positive territory for the day when the daily high is surpassed. Over the past six months, data indicates that when the daily high is breached, the S&P ends the day in the green 68% of the time.
Reviewing such data can offer an additional layer of confirmation before making any trading decisions, especially when combined with proper analysis.
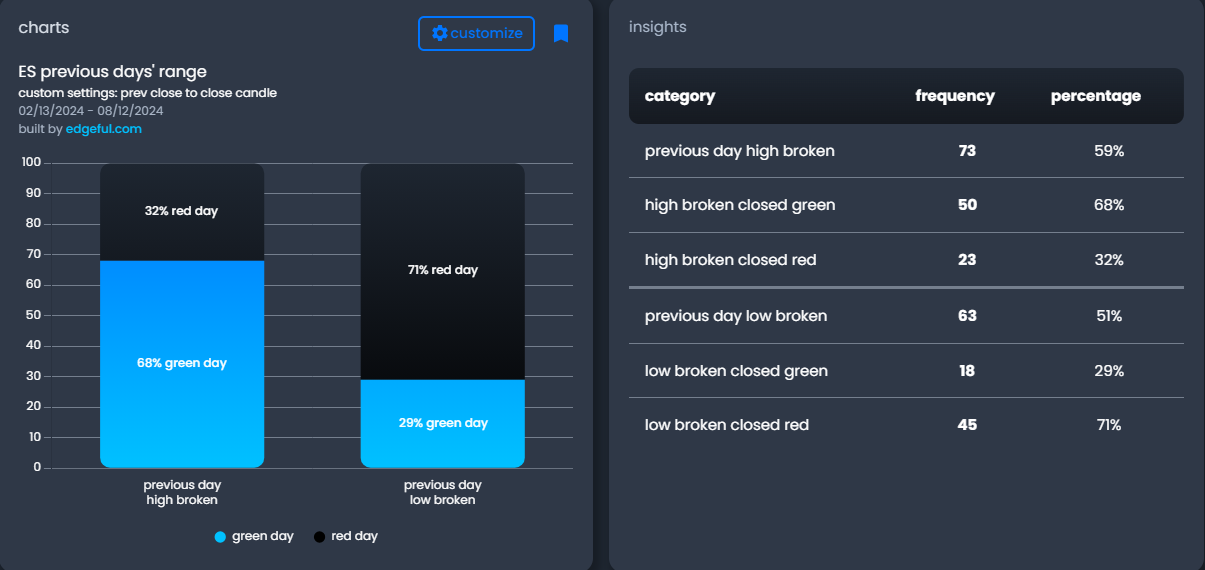
Source: Edgeful
Follow Zain on Twitter/X for Additional Market News and Insights @zvawda
Content is for general information purposes only. It is not investment advice or a solution to buy or sell securities. Opinions are the authors; not necessarily that of OANDA Business Information & Services, Inc. or any of its affiliates, subsidiaries, officers or directors. If you would like to reproduce or redistribute any of the content found on MarketPulse, an award winning forex, commodities and global indices analysis and news site service produced by OANDA Business Information & Services, Inc., please access the RSS feed or contact us at info@marketpulse.com. Visit https://www.marketpulse.com/ to find out more about the beat of the global markets. © 2023 OANDA Business Information & Services Inc.

Zain Vawda
He has spent the last 3 years in an analyst role honing his skills across various financial domains, including technical analysis, economic data interpretation, price action strategies, and analyzing the geopolitical impacts on global markets. Currently, Zain is advancing in obtaining his Capital Markets & Security Analyst (CMSA) designation through the Corporate Finance Institute (CFI), where he has completed modules in fixed income fundamentals, portfolio management fundamentals, equity market fundamentals, introduction to capital markets, and derivative fundamentals.
He is also a regular guest on radio and television programs in South Africa, providing insight into global markets and the economy. Additionally, he has contributed to the development of a financial markets course approved by BankSeta (Banking Sector Education and Training Authority) at NQF level 6 in South Africa.
Latest posts by Zain Vawda (see all)
- Gold (XAU/USD) Technical Analysis: Bullish Structure Emerges - 23 December 2024
- Markets Weekly Outlook – S&P 500 in Focus as Markets Brace for Holiday Lull - 20 December 2024
- Stagflation Fears and Soaring US Yields: S&P 500’s Next Move - 19 December 2024