- Wall Street indexes showed mixed results on Wednesday, with the S&P 500 near all-time highs and the Nasdaq 100 briefly surpassing 20,000.
- Tech stocks, particularly Nvidia and Hewlett Packard, supported the S&P 500, while General Motors and Ford declined after a Morgan Stanley downgrade.
- Technical analysis suggests further upside potential for the S&P 500, with a cup and handle pattern and triangle breakout hinting at a possible 500-point move.
Most Read: Swiss National Bank (SNB) Preview – FX Intervention Chatter, USD/CHF Eyes Range Breakout
The major Wall Street Indexes have continued an earlier trend of uncertainty on this Wednesday morning. The European and Asian sessions saw shares struggle to capitalize following gains posted yesterday.
The S&P 500 continues to languish near all-time highs as the Nas 100 briefly rose above the psychological 20000 mark. The indexes are struggling to make their way higher here as a lack of economic data and ongoing uncertainty continue to plague sentiment.
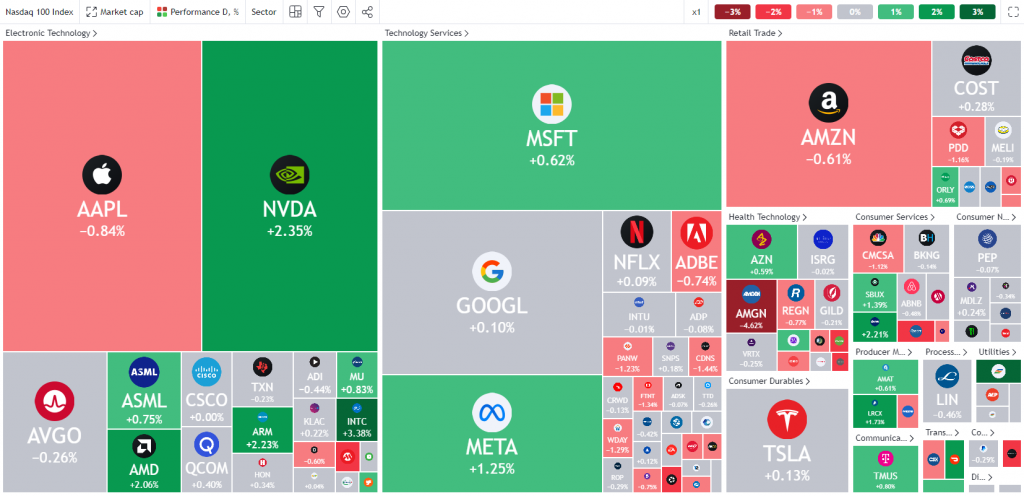
Looking at markets broadly, the tech sector continues to prop up the S&P 500 with Nvidia and Hewlett Packard HPE.N leading the gains. Morgan Stanley downgraded its rating of General Motors GM.N and Ford Motors F.N earlier in the day with both stocks down more than 4% on the day.
NAS 100 Early Session Heatmap
Source: TradingView
The US Home Sales Report released earlier in the day painted a mixed picture, thus not really providing any impetus for significant moves. Interest rates for the most popular US home loan did reach a 2-year low but single-family home sales fell 4.7% from 10.3% in July.
The lack of early week data has left market participants eyeing clues of the rate path of the Federal Reserve. A 50 bps cut is now favored in November with some Fed officials striking a rather dovish tone of late.
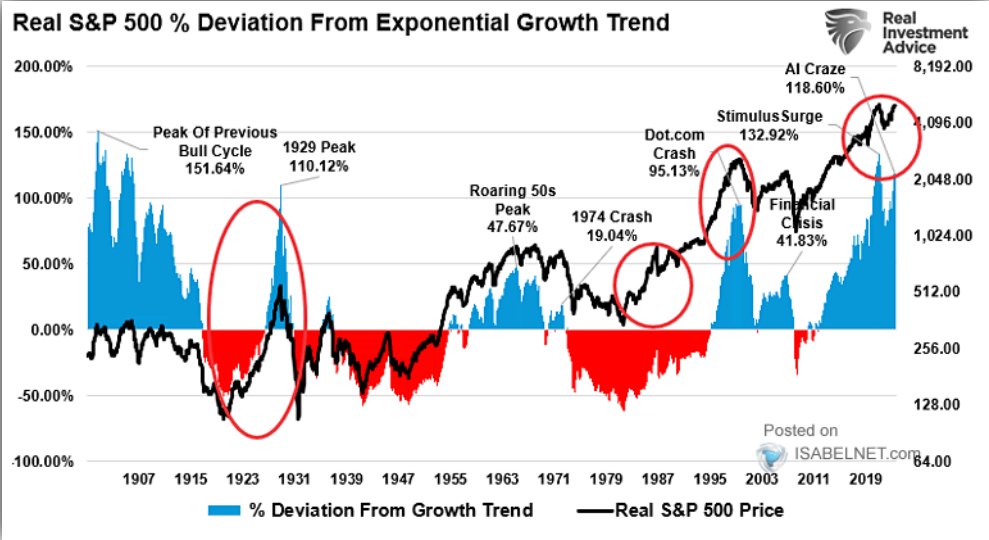
As markets approach fresh highs we are seeing a wee bit of caution here. An interesting chart today by Real Investment Advice and Isabelnet showing the deviation of the S&P 500 from the exponential growth trend. Hinting that current valuations suggest that a return to mean levels are likely in the future.
Source: Isabelnet
Attention will now turn to tomorrow where we have a bunch of Fed policymakers speaking which could give further insight into the Fed November meeting.
This will be followed on Friday by the Federal Reserve preferred inflation gauge, the Core PCE data release. Another miss to the downside here could be the shot in the arm indices need to push on to fresh highs.
Technical Analysis
S&P 500
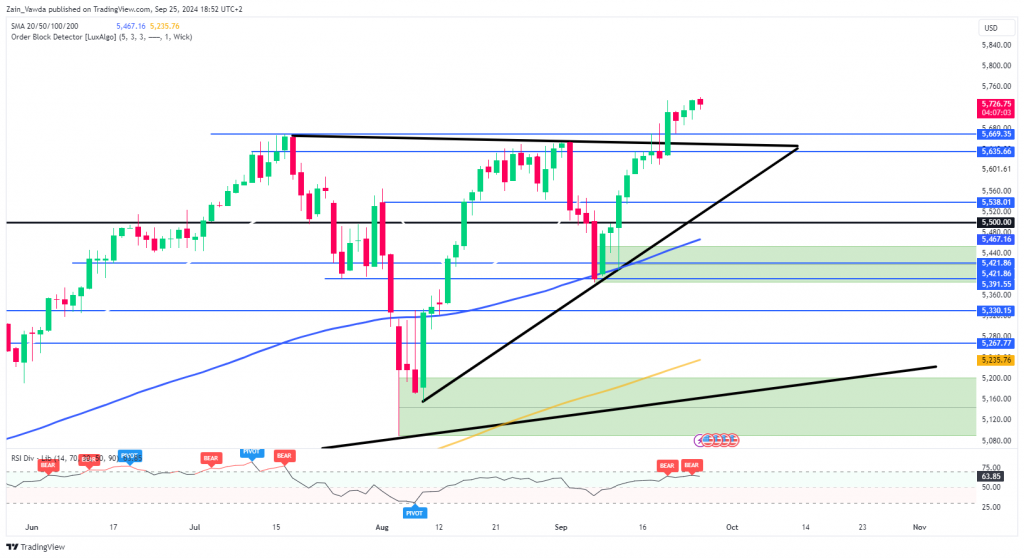
From a technical standpoint, the S&P is in an interesting area. Valuations are running rampant and fundamentally a pullback should be on the mind of most market participants. However, given the rate cut angle as well as technical charting patterns, there could be further upside in store for the index.
There is an excellent cup and handle chart pattern as well as a triangle breakout in play which hint at a potential 500 point move to the upside. This does seem like a stretch given the size of the rally so far this year, as such a move would equate to around 8% of gains for the index.
The pattern however cannot be ignored and has been a longtime in the making. A break and daily candle close below the 5613 would invalidate the cup and handle setup, while a daily candle close back in the triangle pattern would do the same.
The confluences for further bullish price action continue to stack up, will there be follow through?
S&P 500 Daily Chart, September 25, 2024
Source: TradingView (click to enlarge)
Support
- 5669
- 5613
- 5538
Resistance
- 5913
- 6000
- 6169
Follow Zain on Twitter/X for Additional Market News and Insights @zvawda
Content is for general information purposes only. It is not investment advice or a solution to buy or sell securities. Opinions are the authors; not necessarily that of OANDA Business Information & Services, Inc. or any of its affiliates, subsidiaries, officers or directors. If you would like to reproduce or redistribute any of the content found on MarketPulse, an award winning forex, commodities and global indices analysis and news site service produced by OANDA Business Information & Services, Inc., please access the RSS feed or contact us at info@marketpulse.com. Visit https://www.marketpulse.com/ to find out more about the beat of the global markets. © 2023 OANDA Business Information & Services Inc.


