- Wall Street indexes rebounded from Tuesday’s selloff, driven by strong earnings from TSMC and positive economic data.
- Nasdaq 100 approaches all-time highs, fueled by TSMC’s success and AI demand.
- Market sentiment remains optimistic, but concerns persist over high valuations.
Most Read: GBP Price Action Ideas: GBP/USD, GBP/JPY and EUR/GBP
The major Wall Street indexes have bounced back completely from Tuesday’s selloff, which was driven by concerns over tech stocks, particularly chip stocks. The indices surged after Taiwan Semiconductor Manufacturing Co. (TSMC) released its Q3 earnings.
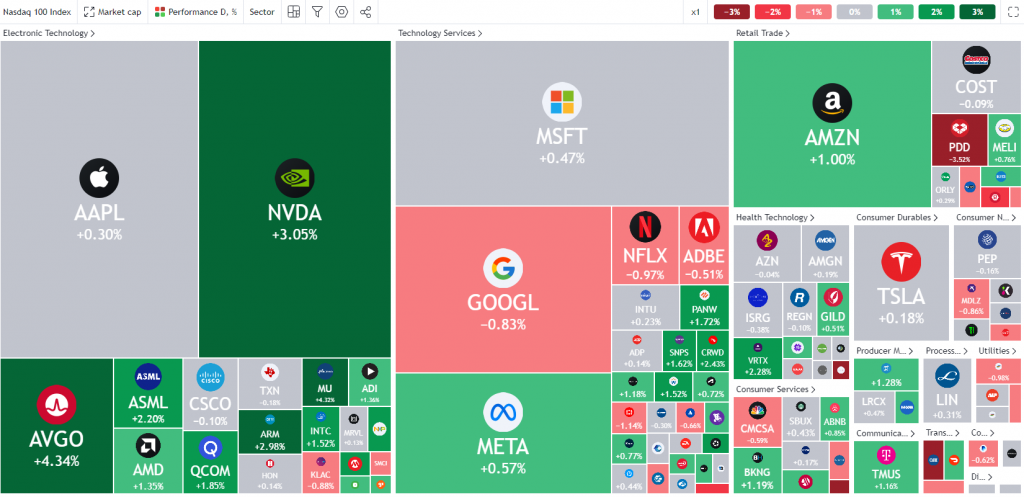
The world’s largest contract chipmaker smashed market estimates for profit while also predicting an increase in fourth quarter revenue (Q4) on AI demand. The U.S.-listed shares of the chipmaker, TSM.N, skyrocketed by 12.2%, while Nvidia, a popular AI-trade stock and TSMC customer, rose by 3%, reaching a new record high.
Nasdaq 100 Heatmap
Source: TradingView
This renewed optimism was further enhanced by an increase in retail sales of 0.4% and a drop in the weekly jobless claims print. All of the data together has led the S&P 500 to fresh highs and the Nasdaq 100 closer to its all-time highs. The question now is will the remaining earnings from the magnificent 7 be enough to push indices even higher?
Later today we have Netflix reporting after the bell which could have an impact as well. There is a lack of high impact data from the US to end the week and general market sentiment is likely to drive markets toward the end of the week. We could see a short-term pullback as some market participants might embark on profit taking ahead of the weekend.
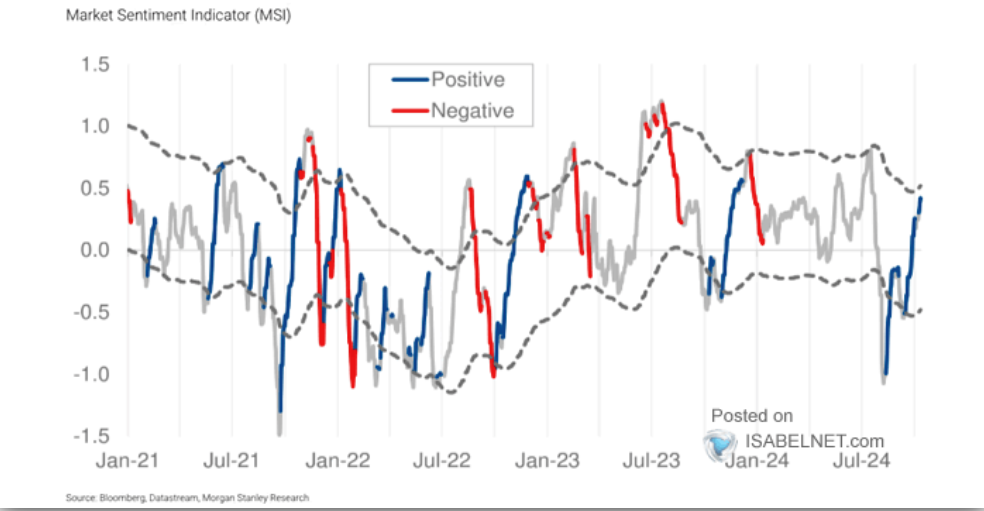
The Morgan Stanley current market sentiment indicator reflects a risk-positive outlook which suggests that market participants are optimistic about the market’s future performance.
Source: Morgan Stanley, Isabelnet
Over the medium-term, many analysts remain concerned that stock prices might be too high, with big expectations for earnings and potential market swings as the U.S. presidential election in November approaches. This makes the reporting by the magnificent 7 even more intriguing as it arrives just before the US election.
Technical Analysis
S&P 500
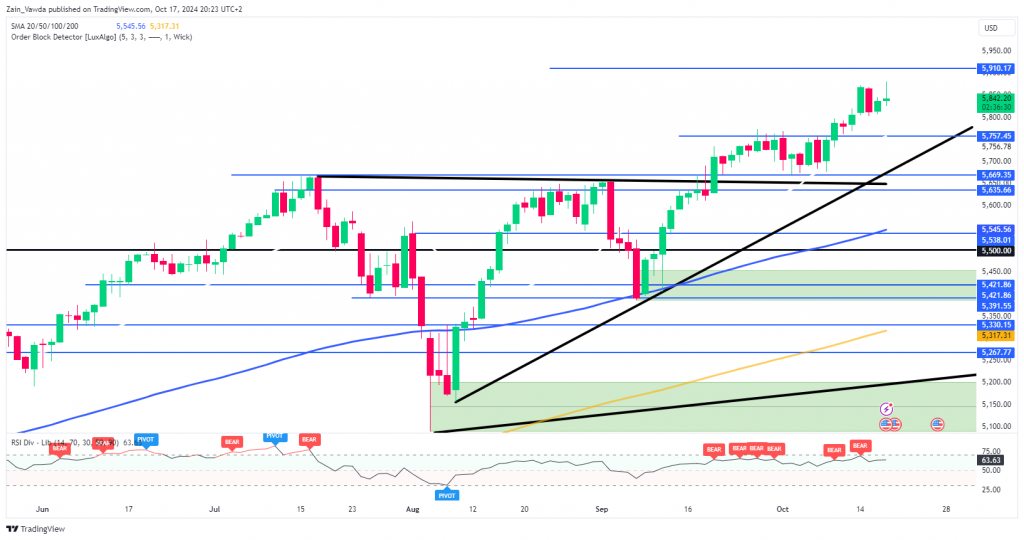
From a technical standpoint, the S&P is continuing its long term move to the upside. For those who have followed my previous articles, the S&P 500 broke out of a triangle pattern a few weeks back. As technical patterns go, the potential targets following the breakout rest around the 5910 handle 6100 handle with the index reaching a fresh high of 5880 today.
The pullback on Tuesday is a positive in my book but as discussed above the risks around stretched valuations etc may concern bulls as we trade at unprecedented levels.
A break above the 5910 handle will lead to a run toward the psychological 6000 handle which could prove a stubborn stumbling block. This could mean that a retracement may take place before the index makes a run for the 61000 handle.
Looking at immediate support and a key level rests at 5757 with a break lower running into the ascending trendline. A daily candle close below the swing low at 5669 invalidates the bullish setup and could see the S&P 500 record a deeper pullback.
S&P 500 Daily Chart, October 17, 2024
Source: TradingView (click to enlarge)
Support
- 5757
- 5669
- 5635
Resistance
- 5880
- 5910
- 6000
Nasdaq 100
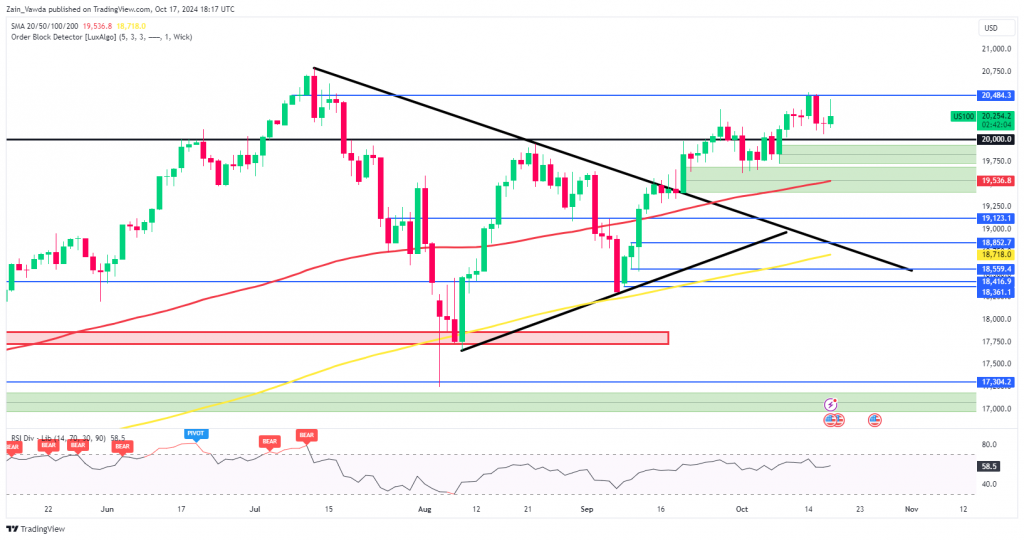
The nasdaq 100 looked set to be closing as a morningstar candlestick pattern but a pullback just before i wrote this article leaves the pattern up in the air. A morningstar candlestick pattern is no guarantee but would increase the probability of a breakout above the immediate highs at 20484.
The bullish trend remains valid as long as the Nasdaq 100 remains above the swing low at 19750. A daily candle close below this level would invalidate a potential bullish continuation.
Immediate support rests at 20000 and then of course 19750 and the 100-day MA at 19536.
Nasdaq 100 Daily Chart, October 17, 2024
Source: TradingView (click to enlarge)
Support
- 20000
- 19750
- 19536
Resistance
- 20484
- 20790 (all-time highs)
- 21000
Follow Zain on Twitter/X for Additional Market News and Insights @zvawda
Content is for general information purposes only. It is not investment advice or a solution to buy or sell securities. Opinions are the authors; not necessarily that of OANDA Business Information & Services, Inc. or any of its affiliates, subsidiaries, officers or directors. If you would like to reproduce or redistribute any of the content found on MarketPulse, an award winning forex, commodities and global indices analysis and news site service produced by OANDA Business Information & Services, Inc., please access the RSS feed or contact us at info@marketpulse.com. Visit https://www.marketpulse.com/ to find out more about the beat of the global markets. © 2023 OANDA Business Information & Services Inc.


