- Recent rebound in WTI crude has remained below US$90/barrel which in turn led to a softening of inflationary expectations via the breakeven rates.
- A further downward drift in the 10-year US breakeven rate may a further drop in the 10-year US Treasury real yield.
- Lower opportunity costs in hold Gold (XAU/USD) support the potential start of another medium-term bullish impulsive upmove sequence above US$2,285 key support.
This is a follow-up analysis of our prior report, “Gold Technical: On the brink of a potential multi-week corrective decline” published on 10 June 2024. Click here for a recap.
Since our last publication, the price actions of Gold (XAU/USD) have drifted sideways with an attempt to retest the recent 7 June intraday low of US$2,286, triggered by the release of China’s official reserves data that showed a pause on its bullion purchases in May after 18 consecutive months of gold buying in the prior months.
Gold (XAU/USD) has attempted to seek a retest on US$2,286 as it drifted lower in the week of 24 June and it printed an intraday low of US$2,293 on 26 June on a slew of cautious Fed Speak from the US central bank officials that supported a “data dependent, wait and see” approach before taking action to enact the first Fed funds rate cut after on hold for the 7th consecutive meeting on 12 June.
One of the primary reasons for a cautious stance toward monetary policy easing in the US has been the fear of entrenched inflationary expectations (that’s future consumer inflation either 1-year or 5-year from today) that tends to lead to an upside wage-price spiral.
Softer trends in inflationary expectations since April
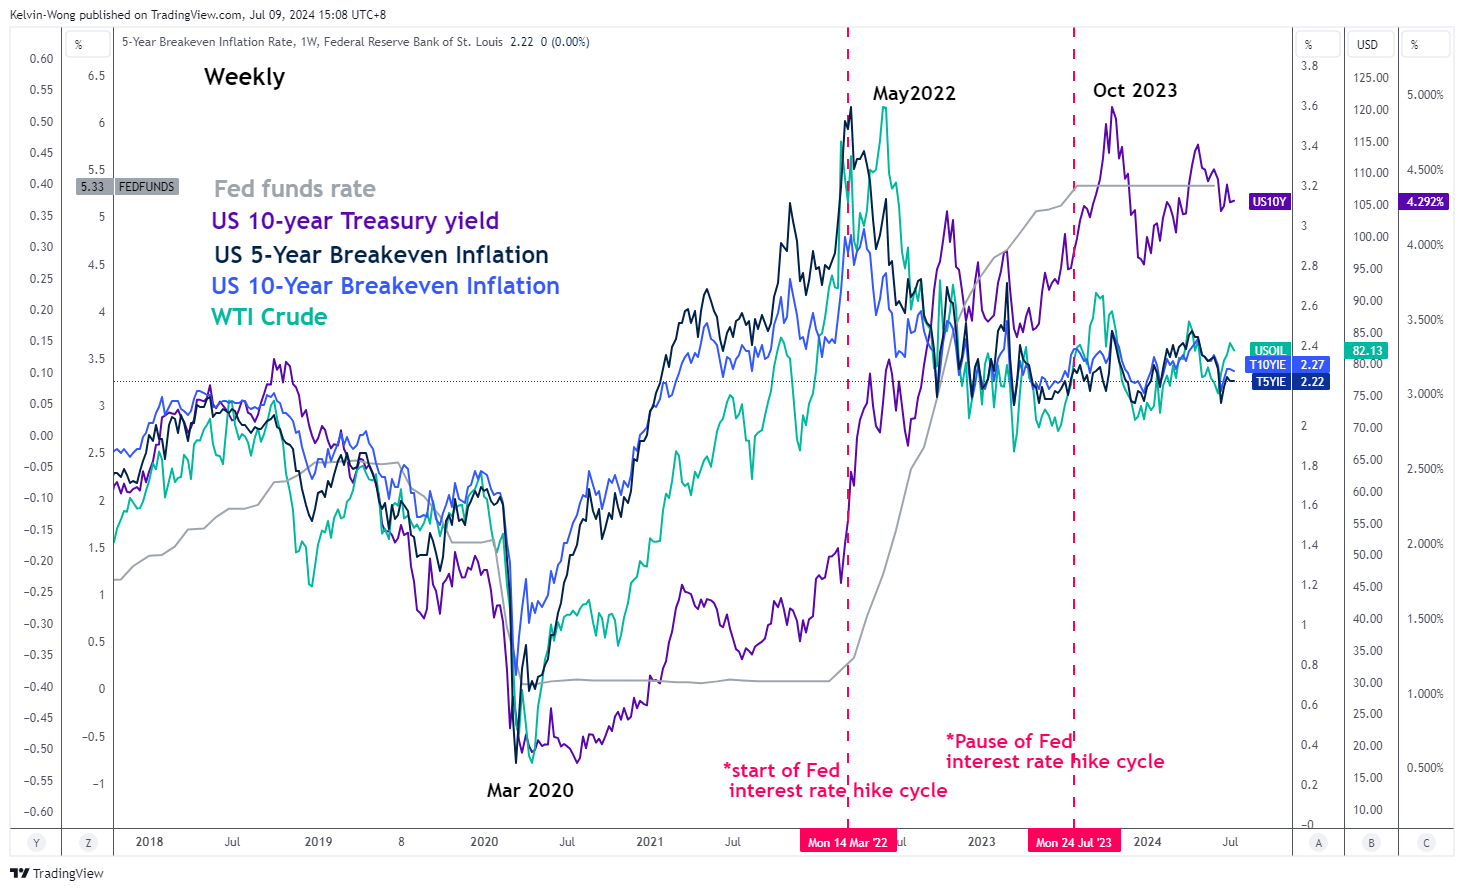
Fig 1: WTI crude & 5-YR/10-YR US breakeven rates major trends as of 9 Jul 2024 (Source: TradingView, click to enlarge chart)
We can measure inflationary expectations from either a survey-based approach or inferred from market-based transacted financial instruments such as the US Treasury Inflation-Protected Securities (TIPS) via their respective tenure breakeven rates.
Since the start of the pandemic in March 2020, the movements of the 5-year and 10-year US Treasury breakeven rates have moved in direct tandem with the prices of WTI crude oil. That’s intuitive as higher oil prices can lead to higher inflationary expectations because the cost of production and business increases since oil is considered either directly or indirectly as an input resource.
Since April 2024, the price of WTI crude has been capped at US$90 per barrel due to the recent OPEC+ decision not to extend its additional supply cuts of 2.2 million barrels per day beyond the end of September 2024 and gradually phase out these cuts over the course of a year from October 2024 to September 2025.
Hence, it has caused the 5-year and 10-year break-even rates to drift lower since April to 2.22% and 2.27% respectively at this time of the writing, which is also approaching the “desired” 2% inflation target set by the Fed as some conservative Fed officials deemed the “2% level” as a better gauge to infer that inflationary pressure has subsided which supports enacting an interest rate cut cycle (see Fig 1).
The 10-year US Treasury real yield is now at a critical juncture
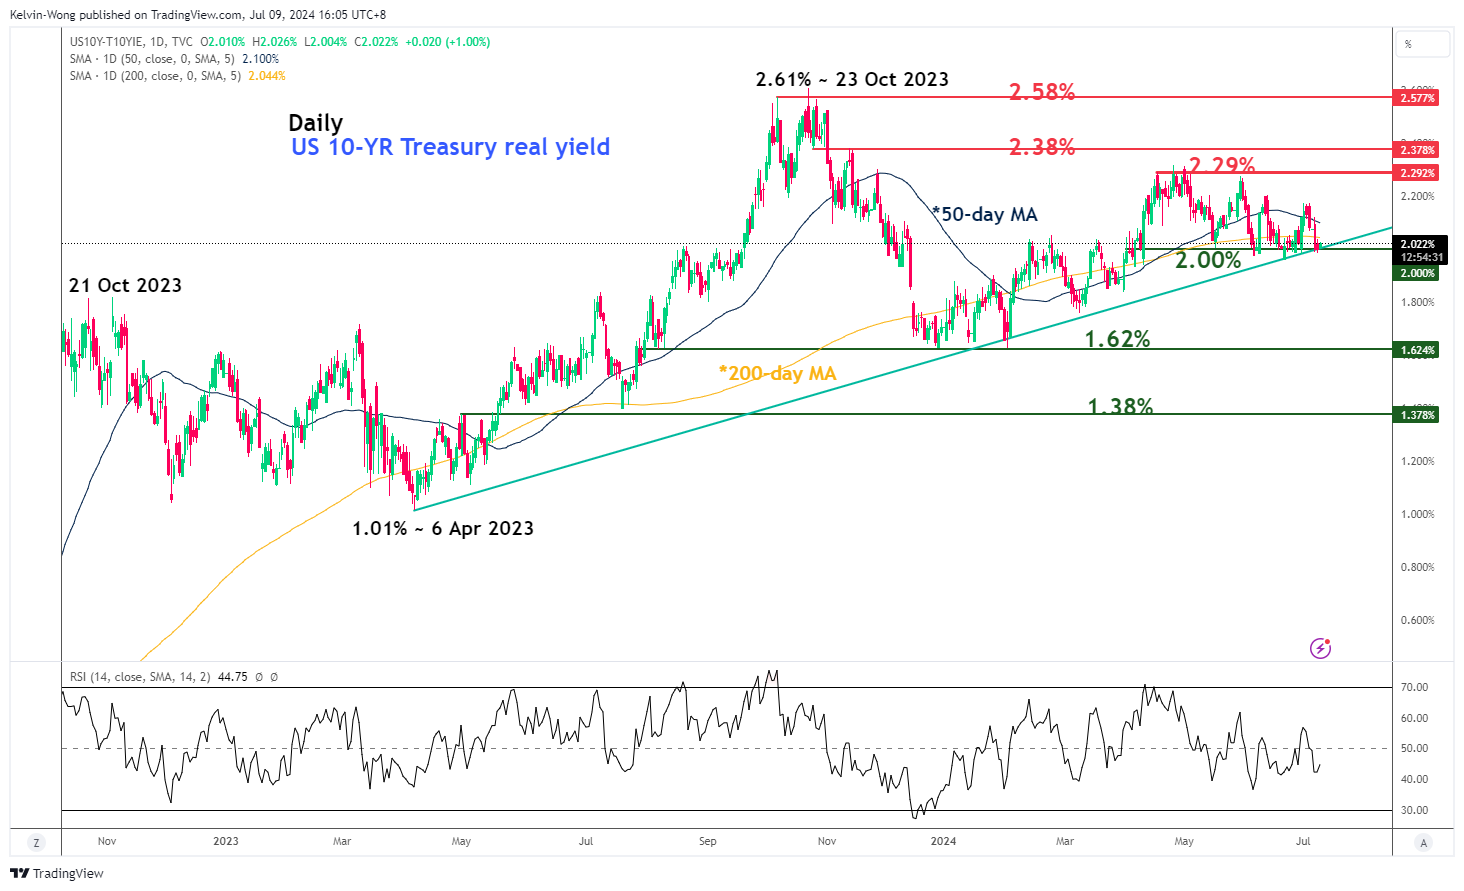
Fig 2: US 10-YR Treasury real yield major & medium-term trends as of 9 July 2024 (Source: TradingView, click to enlarge chart)
Since 26 April 2026, the 10-year US Treasury real yield has drifted lower from 2.61% to 2.02% at this time of the writing due to the softening of the 10-year breakeven rate mentioned earlier.
A break below its major support of 2% (also the major ascending trendline from the 6 April 2023 low that held prior decline in price actions) may trigger a more significant potential corrective decline sequence to expose the next medium-term support of 1.62% in the first step (see Fig 2).
A prospect of a lower 10-year US Treasury real yield in the medium-term looks to be gaining traction which in turn implies a lower opportunity cost of holding Gold (XAU/USD) as it is a non-interest or fixed-income bearing asset.
Bulls recaptured the 20-day and 50-day moving averages
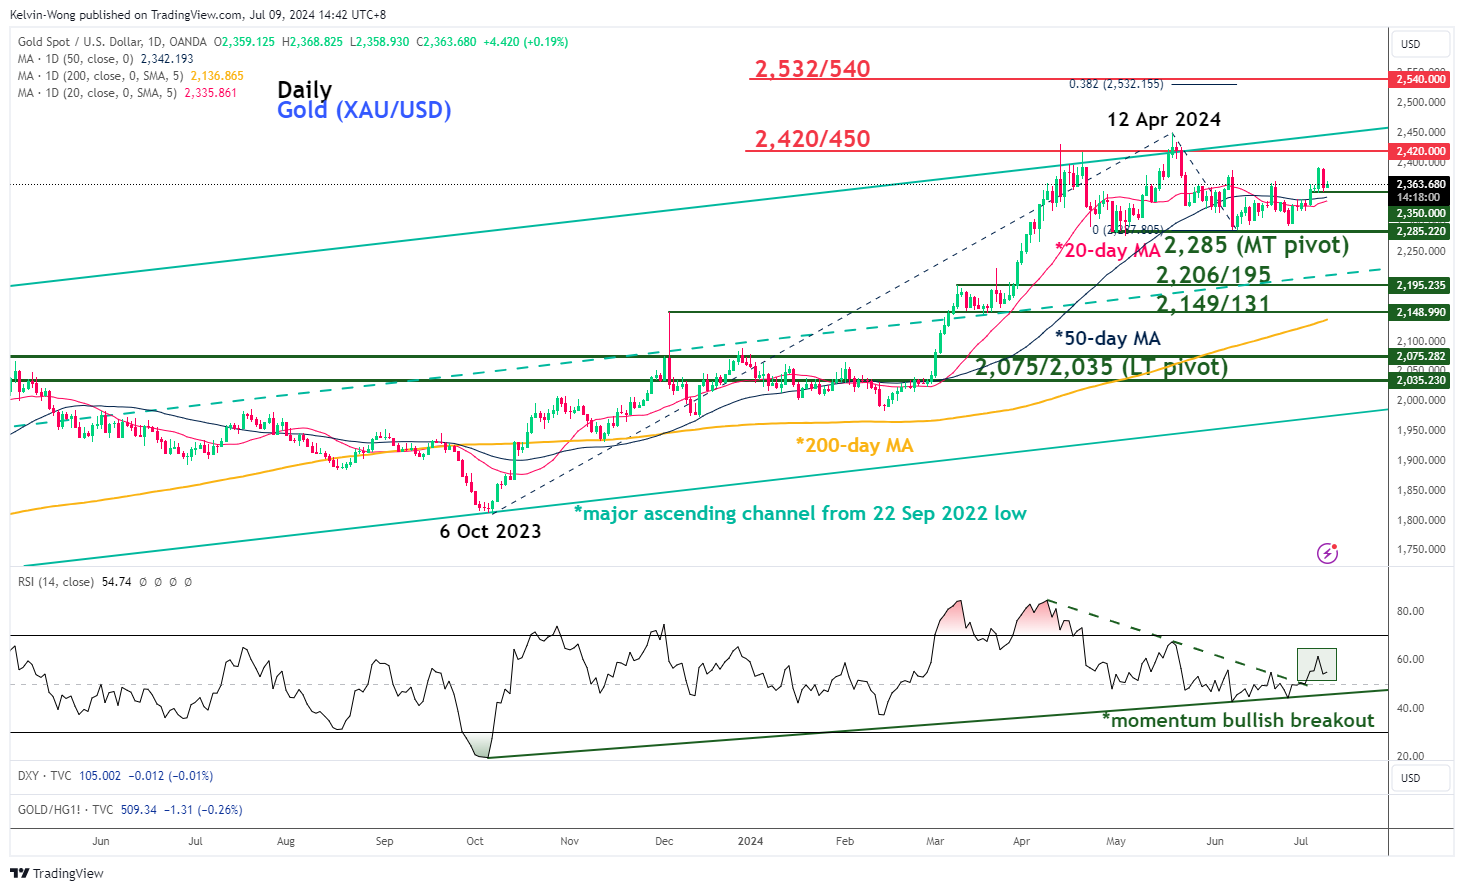
Fig 3: Gold (XAU/USD) major & medium-term trends as of 9 July 2024 (Source: TradingView, click to enlarge chart)
Since last Wednesday, 3 July, the price actions of Gold (XAU/USD) have broken above both its 20-day and 50-day moving averages.
In addition, the daily RSI momentum indicator has also staged a parallel bullish breakout above its 50 level which suggests a potential revival of medium-term bullish momentum that in turn supportive of a possible start of a new bullish impulsive upmove sequence for Gold (XAU/USD).
If the US$2,285 key medium-term pivotal support holds, Gold (XAU/USD) may see a retest on its current April all-time high area that is considered as the first medium-term resistance zone of US$2,420/450, and a break above it sees the next medium-term resistance zone coming in at US$2,532/540 (see Fig 3).
However, failure to hold at US$2,285 invalidates the bullish tone for a continuation of the correct decline sequence within its major uptrend phase to expose the next medium-term supports at US$2,206/195 and US$2,149/131.
Content is for general information purposes only. It is not investment advice or a solution to buy or sell securities. Opinions are the authors; not necessarily that of OANDA Business Information & Services, Inc. or any of its affiliates, subsidiaries, officers or directors. If you would like to reproduce or redistribute any of the content found on MarketPulse, an award winning forex, commodities and global indices analysis and news site service produced by OANDA Business Information & Services, Inc., please access the RSS feed or contact us at info@marketpulse.com. Visit https://www.marketpulse.com/ to find out more about the beat of the global markets. © 2023 OANDA Business Information & Services Inc.

Kelvin Wong
Passionate about connecting the dots in the financial markets and sharing perspectives around trading and investment, Kelvin Wong is an expert in using a unique combination of fundamental and technical analyses, specializing in Elliott Wave and fund flow positioning, to pinpoint key reversal levels in the financial markets.
In addition, over the last ten years, Kelvin has conducted numerous market outlook and trading-related seminars, as well as technical analysis training courses, for thousands of retail traders.
Latest posts by Kelvin Wong (see all)
- Nasdaq 100 Technical: At risk of staging a multi-week corrective decline - 20 December 2024
- Gold Technical: A less dovish Fed may reinforce a medium-term corrective decline - 16 December 2024
- AUD/USD: Surviving at the 0.6360 key support (for now) but the long-term trend remains bearish - 13 December 2024